|

Silver Price Analysis: XAG/USD pierces $24.00 to renew monthly high

  • Silver remains on the front foot around intraday/monthly high.
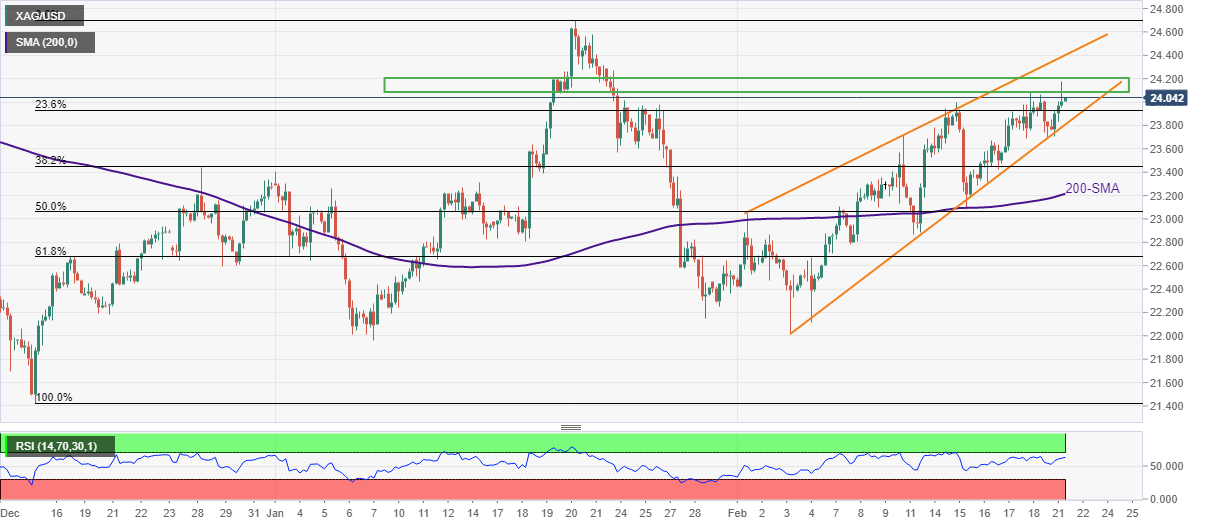
  • Rising wedge, five-week-old horizontal hurdle to challenge buyers.
  • 200-SMA acts as extra support to confirm downside bias.

Silver (XAG/USD) prices remain firmer for the fifth consecutive day, up 0.25% intraday near $24.00 during Tuesday’s Asian session.

In doing so, the bright metal refreshes monthly light while staying inside a three-week-old rising wedge bearish chart pattern.

Also challenging the XAG/USD bulls is a horizontal area comprising multiple levels marked during late January, near $24.10-20.

It’s worth noting that the RSI line quickly approaches the overbought territory and may challenge the silver buyers around $24.20, if not then January’s peak of $24.70 will be in focus.

On the flip side, pullback moves may aim for breaking the rising wedge’s support line, around $23.80 by the press time.

A clear downside break of $23.80 will confirm the bearish chart pattern suggesting a fresh low of 2022, below the current figure of $21.95.

During the fall, the 200-SMA level of $23.20 and the $22.00 threshold may act as intermediate halts.

Silver: Four-hour chart

Trend: Pullback expected

Additional important levels

Overview
Today last price24.01
Today Daily Change0.04
Today Daily Change %0.17%
Today daily open23.97
 
Trends
Daily SMA2023.21
Daily SMA5023.05
Daily SMA10023.31
Daily SMA20024.25
 
Levels
Previous Daily High24.06
Previous Daily Low23.7
Previous Weekly High24.09
Previous Weekly Low23.08
Previous Monthly High24.7
Previous Monthly Low21.96
Daily Fibonacci 38.2%23.92
Daily Fibonacci 61.8%23.84
Daily Pivot Point S123.76
Daily Pivot Point S223.55
Daily Pivot Point S323.39
Daily Pivot Point R124.12
Daily Pivot Point R224.28
Daily Pivot Point R324.49

Author

Anil Panchal

Anil Panchal

FXStreet

Anil Panchal has nearly 15 years of experience in tracking financial markets. With a keen interest in macroeconomics, Anil aptly tracks global news/updates and stays well-informed about the global financial moves and their implications.

More from Anil Panchal
Share:

Editor's Picks

AUD/USD eyes 0.7150 barrier nine-day EMA

AUD/USD inches higher after registering modest losses in the previous day, trading around 0.7130 during the Asian hours. The technical analysis of the daily chart indicates that the pair is moving sideways within the rectangle pattern, suggesting a consolidation as neither the bulls nor the bears have enough momentum to take control of the market.

USD/JPY trades below 160.00 intervention threshold; bullish bias intact

The USD/JPY pair attracts some sellers during the Asian session amid fears that authorities will step in again to prop up the Japanese Yen. Furthermore, the Israel-Lebanon truce prompts some profit-taking around the US Dollar and exerts downward pressure on the currency pair.

Gold puts its 200-day SMA to the test near $4,420

Gold keeps the bullish stance in place in the latter part of Thursday’s session, although a convincing break above the key $4,500 mark per troy ounce still remains elusive. The precious metal’s advance comes amid the resurgence of some selling interest around the Greenback, improving risk sentiment, and declining US Treasury yields across the board.

Bitcoin’s massive storm is back: Why the sell-off is far from over

Bitcoin price action over the last few weeks has felt less like a normal, healthy correction and more like a slow grinding crash that continues to wreak havoc on holdings and trading accounts. And everything suggests that the dramatic crash isn’t over.

Nonfarm payrolls: Testing the limits of Fed policy patience

The upcoming nonfarm payrolls report for May will provide the final update on the US labor market before Kevin Warsh attends his first policy meeting as the new Fed Chair later this month.

Recession on paper: What really moves the Canadian Loonie now?

Statistics Canada handed the headline writers a gift and the analysts a headache. Real GDP shrank 0.1% on an annualized basis in the first quarter, and with the fourth quarter of 2025 revised down to a 1.0% contraction, that is two negative quarters in a row, the textbook definition of a technical recession and Canada's first since the pandemic.