EUR/USD is practically flat awaiting the release of US employment data
- EUR/USD remains steady below 1.1700 in a bearish trend from late-December highs.
- Eurozone Consumer inflation moderated further in December.
- FX volatility remains subdued on Wednesday, ahead of key US macroeconomic releases.

EUR/USD is practically flat, trading near 1.1690 at the time of writing, with the bearish bias from December highs intact. Eurozone inflation figures confirmed that price pressures remain weak, which left the pair trading sideways near three-week lows, with investors awaiting the release of key US employment figures.
Data released by Eurostat on Wednesday revealed that the Eurozone Harmonized Index of Consumer Prices (HICP) eased to a 2.0% yearly rate in December, as expected, from 2.1% in November. Likewise, the core HICP slowed down to a 2.3% year-on-year growth, from 2.4% in November, in this case beating expectations of a steady 2.4% reading.
Markets, however, remain calm in spite of the growing geopolitical risks. The US intervention in Venezuela is not triggering major government changes in the country, and US President Donald Trump has announced a $2 billion deal to export Venezuelan Oil to the US.
The main focus today remains on the release of the US JOLTS Job Openings data and the ADP Employment report. These figures will set the tone for Friday's key US Nonfarm Payrolls (NFP) report, and are expected to shed some light on the US Federal Reserve's (Fed) monetary policy plans.
Euro Price Today
The table below shows the percentage change of Euro (EUR) against listed major currencies today. Euro was the strongest against the British Pound.
| USD | EUR | GBP | JPY | CAD | AUD | NZD | CHF | |
|---|---|---|---|---|---|---|---|---|
| USD | 0.00% | 0.04% | -0.09% | 0.04% | 0.03% | -0.02% | -0.01% | |
| EUR | -0.01% | 0.04% | -0.11% | 0.04% | 0.02% | -0.03% | -0.02% | |
| GBP | -0.04% | -0.04% | -0.15% | -0.00% | -0.01% | -0.05% | -0.05% | |
| JPY | 0.09% | 0.11% | 0.15% | 0.15% | 0.14% | 0.08% | 0.10% | |
| CAD | -0.04% | -0.04% | 0.00% | -0.15% | -0.01% | -0.07% | -0.05% | |
| AUD | -0.03% | -0.02% | 0.01% | -0.14% | 0.00% | -0.05% | -0.03% | |
| NZD | 0.02% | 0.03% | 0.05% | -0.08% | 0.07% | 0.05% | 0.02% | |
| CHF | 0.00% | 0.02% | 0.05% | -0.10% | 0.05% | 0.03% | -0.02% |
The heat map shows percentage changes of major currencies against each other. The base currency is picked from the left column, while the quote currency is picked from the top row. For example, if you pick the Euro from the left column and move along the horizontal line to the US Dollar, the percentage change displayed in the box will represent EUR (base)/USD (quote).
Daily Digest Market Movers: Markets calm awaiting key US data
- The EUR/USD is moving within a tight range on Wednesday, with investors bidding their time ahead of the release of a string of US employment indicators that might help assess the scope of the Fed's monetary easing cycle.
- Data from Germany released earlier on Wednesday revealed that Retail Sales declined 0.6% in November, following a 0.3% drop in October, against market expectations of a 0.2% gain. Year-on-year, retail consumption grew 1.1% after a 0.9% rise in October.
- These figures come after a weaker-than-expected German Harmonized Index of Consumer Prices (HICP), which eased to a 2.0% year-on-year rate in December, from 2.6% in November, below the market consensus of 2.2%.
- Furthermore Eurozone's S&P Services PMI for December was revised down to 52.4 from the previously restimated 52.6 reading, and from 53.6 in November.
- In the US, on Wednesday, the ADP Employment report is expected to show a 47,000 increase in net employment in December, which would offset the 32,000 decline seen in November.
- Also on Wednesday, the US Bureau of Labor Statistics will release November's JOLTS Job Openings, which are seen easing to 7.6 million from 7.67 million in October.
- Investors will also be attentive to the US ISM Services PMI, which is expected to show a 52.3 reading in December, down from 52.6 in November, still at levels consistent with significant growth.
Technical Analysis: EUR/USD remains in a downtrend from 1.1800
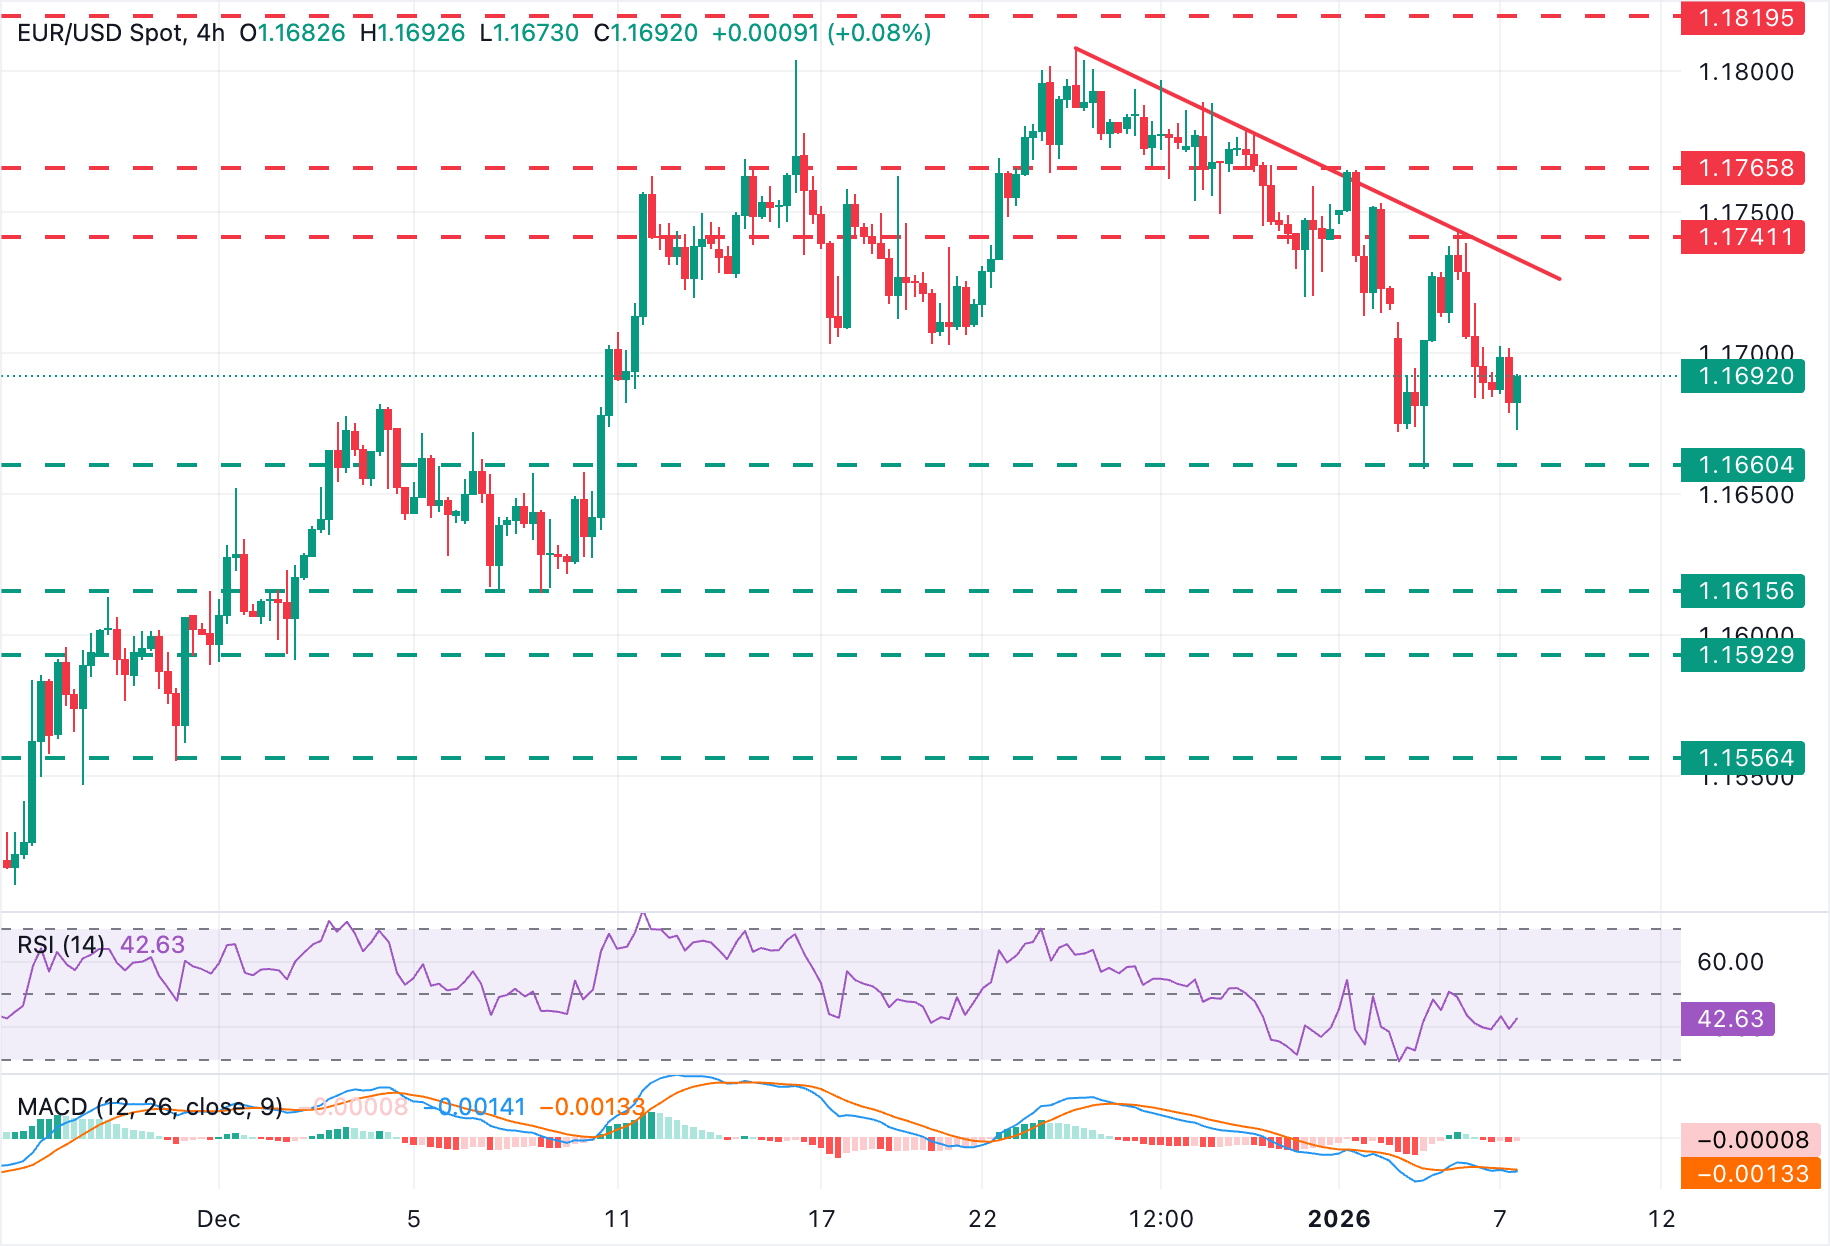
The EUR/USD is in a bearish correction from late December highs of 1.1808, with support at the 1.1650 area. Technical indicators in the 4-hour chart show a neutral-to-negative bias. The 4-hour Moving Average Convergence Divergence (MACD) histogram bars are moving around the zero level, suggesting a lack of momentum, while the Relative Strength Index (RSI) remains in negative territory at 40.
To the downside, Monday's low of 1.1659 is closing the path towards the December 8 and 9 lows, in the area of 1.1615. On the other side, upside attempts remain capped below 1.1700 so far. Further up, the descending trendline from December highs, at 1.1735, and Tuesday's high, at 1.1740, are the next targets.
(This story was corrected on January 7 at 12:57 GMT to say that the upside could target the descending trendline from December highs, not from December lows.)
Economic Indicator
ADP Employment Change
The ADP Employment Change is a gauge of employment in the private sector released by the largest payroll processor in the US, Automatic Data Processing Inc. It measures the change in the number of people privately employed in the US. Generally speaking, a rise in the indicator has positive implications for consumer spending and is stimulative of economic growth. So a high reading is traditionally seen as bullish for the US Dollar (USD), while a low reading is seen as bearish.
Read more.Next release: Wed Jan 07, 2026 13:15
Frequency: Monthly
Consensus: 47K
Previous: -32K
Source: ADP Research Institute
Traders often consider employment figures from ADP, America’s largest payrolls provider, report as the harbinger of the Bureau of Labor Statistics release on Nonfarm Payrolls (usually published two days later), because of the correlation between the two. The overlaying of both series is quite high, but on individual months, the discrepancy can be substantial. Another reason FX traders follow this report is the same as with the NFP – a persistent vigorous growth in employment figures increases inflationary pressures, and with it, the likelihood that the Fed will raise interest rates. Actual figures beating consensus tend to be USD bullish.
Economic Indicator
JOLTS Job Openings
JOLTS Job Openings is a survey done by the US Bureau of Labor Statistics to help measure job vacancies. It collects data from employers including retailers, manufacturers and different offices each month.
Read more.Next release: Wed Jan 07, 2026 15:00
Frequency: Monthly
Consensus: 7.6M
Previous: 7.67M
Source: US Bureau of Labor Statistics
Author

Guillermo Alcala
FXStreet
Graduated in Communication Sciences at the Universidad del Pais Vasco and Universiteit van Amsterdam, Guillermo has been working as financial news editor and copywriter in diverse Forex-related firms, like FXStreet and Kantox.


