Silver Price Analysis: XAG/USD eyes 100-DMA after symmetrical triangle breakdown
- Silver looks to extend losses while clinging onto 21-DMA.
- XAG/USD charted symmetrical triangle breakdown on the daily chart.
- Downside appears more compelling amid bearish RSI.

Silver (XAG/USD) is trading in a familiar range so far this Wednesday, defending the $24 mark while the bears look to extend control in the near-term.
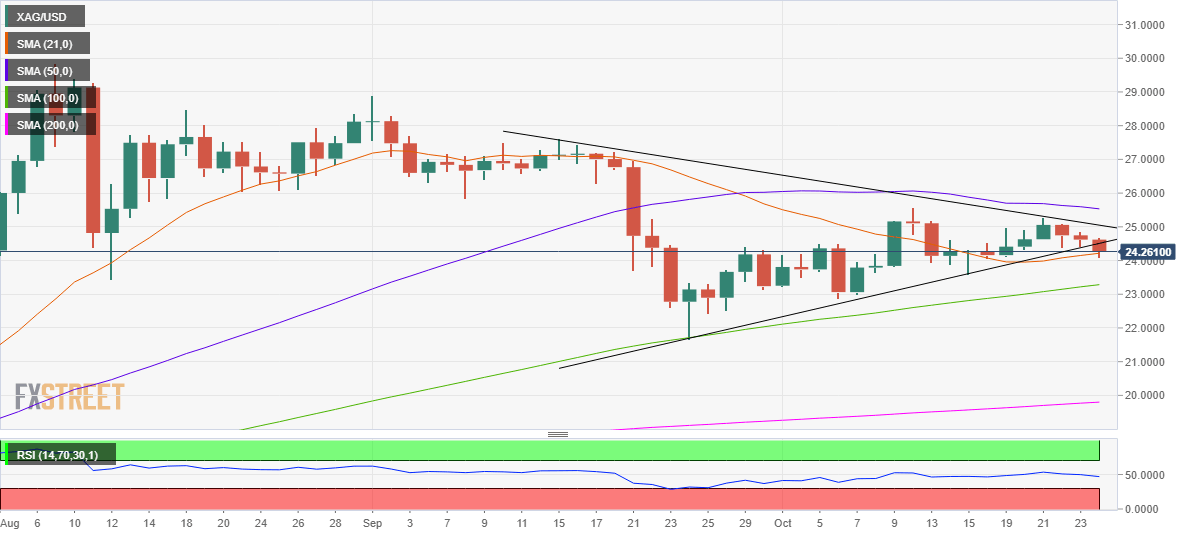
The spot is clinging onto the 21-daily moving average (DMA) at $24.25, awaiting a fresh catalyst to resume the move lower.
It's worth noting that the price charted a symmetrical triangle breakdown on the daily chart last Monday, having closed the day below the rising trendline (pattern) support, then at $24.51.
On a fresh selling wave, the white metal is likely to test the 100-DMA support at $23.41. A break below the latter could expose the September 24 low of $21.65.
The daily Relative Strength Index (RSI) inches lower, below the midline, at 46.81, pointing towards the additional downside.
To the upside, the pattern support-turned-resistance, now at $24.76, needs to be scaled, in order to trigger a pullback towards the $25 mark.
XAG/USD: Daily chart
XAG/USD: Additional levels
Author

Dhwani Mehta
FXStreet
Residing in Mumbai (India), Dhwani is a Senior Analyst and Manager of the Asian session at FXStreet. She has over 10 years of experience in analyzing and covering the global financial markets, with specialization in Forex and commodities markets.

















