|

Silver Price Analysis: XAG/USD corrects from three-week top, holds above $24.00 mark

  • Silver meets with some supply and erodes a part of the overnight gains to a three-week peak.
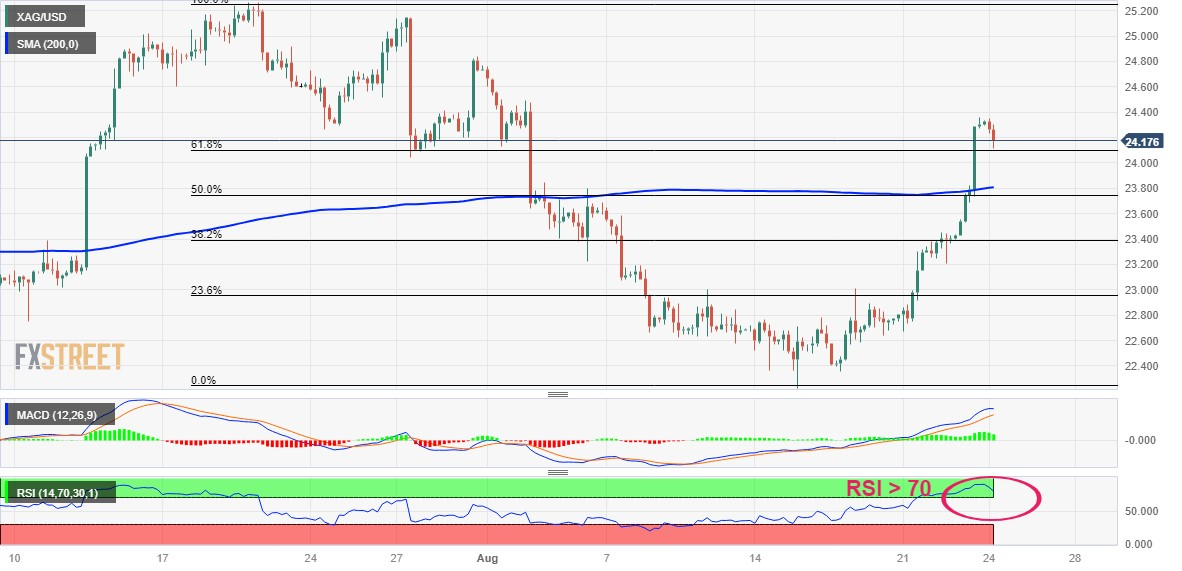
  • Extremely overbought RSI on hourly charts prompts traders to lighten some of their bullish bets.
  • Any subsequent slide might still be seen as a buying opportunity and is likely to remain limited.

Silver comes under some selling pressure on Thursday and for now, seems to have snapped a five-day winning streak to a three-week high, around the $24.35 region touched the previous day. The white metal extends intraday descent through the early European session and drops to a fresh daily low, around the $24.15 region in the last hour.

From a technical perspective, the extremely overbought Relative Strength Index (RSI) on hourly charts turns out to be a key factor that prompts some long-unwinding around the XAG/USD. That said, oscillators on the daily chart have just started gaining positive traction. Furthermore, the overnight breakout through the $23.75 confluence, comprising the 200-period Simple Moving Average (SMA) on the 4-hour chart and the 50% Fibonacci retracement level of the July-August downfall, favours bulls.

Hence, any subsequent slide below the $24.00 round-figure mark is more likely to attract fresh buyers near the aforementioned confluence breakpoint, now turned support. This should help limit the downside for the XAG/USD near the $23.40 region. This is closely followed by support near the $23.25 area, which if broken could drag the white metal back towards the $23.00 mark. A convincing break below the latter will negate the positive outlook and shift the near-term bias in favour of bearish traders.

On the flip side, bulls might now wait for some follow-through buying beyond the overnight swing high, around the $24.35 area, before placing fresh bets. The XAG/USD might then aim to surpass the $24.55-$24.60 intermediate hurdle and climb further to the $25.00 psychological mark en route to the July monthly swing high, around the $25.25 zone. Some follow-through buying will mark a fresh breakout and pave the way for a further near-term appreciating move toward the $26.00 round figure.

Silver 4-hour chart

fxsoriginal

Technical levels to watch

XAG/USD

Overview
Today last price24.15
Today Daily Change-0.17
Today Daily Change %-0.70
Today daily open24.32
 
Trends
Daily SMA2023.32
Daily SMA5023.52
Daily SMA10023.99
Daily SMA20023.32
 
Levels
Previous Daily High24.36
Previous Daily Low23.41
Previous Weekly High23.01
Previous Weekly Low22.23
Previous Monthly High25.27
Previous Monthly Low22.52
Daily Fibonacci 38.2%24
Daily Fibonacci 61.8%23.77
Daily Pivot Point S123.7
Daily Pivot Point S223.08
Daily Pivot Point S322.75
Daily Pivot Point R124.65
Daily Pivot Point R224.98
Daily Pivot Point R325.6

Author

Haresh Menghani

Haresh Menghani is a detail-oriented professional with 10+ years of extensive experience in analysing the global financial markets.

More from Haresh Menghani
Share:

Editor's Picks

AUD/USD consolidates above 0.7000/two-month low; bearish potential intact

The AUD/USD pair oscillates in a narrow range during the Asian session, and moves little following the release of mixed inflation figures from China. Spot prices currently trade around the 0.7025 region, nearly unchanged for the day, and remain within striking distance of a nearly two-month low set on Tuesday. Renewed hostilities between the US and Iran temper hopes for a deal to end the over three-month-old war.

Japanese Yen languishes despite wholesale inflation accelerates in May

USD/JPY flatlines after experiencing volatility, trading around 160.40 during the Asian hours on Wednesday. The pair continues to hold its ground, reflecting a struggling Japanese Yen that has failed to find support despite a massive acceleration in wholesale inflation. Driven by surging energy costs linked to the ongoing Middle East conflict, Japan’s Producer Price Index jumped 6.3% year-over-year in May. This hot printing comfortably outpaced April’s upwardly revised 5.3% figure and surpassed market consensus of 5.5%, marking the fastest pace of wholesale price growth in three years.

$4,200: Gold retains bearish bias near March low ahead of US CPI

Gold recovers slightly after touching a fresh low since March 23, though it retains a bearish bias near the $4,200 mark through the early European session. Renewed hostilities between the US and Iran fuel inflationary concerns and bolster bets for more hawkish central banks, which is seen as a key factor driving flows away from the non-yielding yellow metal. Furthermore, the decline could be attributed to technical selling following the recent breakdown below the very important 200-day SMA.

Cardano's downtrend deepens despite on-chain bottoming signals

Cardano edges lower to $0.1600 signaling a potential extension of the 30% loss from last week. The altcoin remains under intense selling pressure, weighing on its retail support. Still, a spike in dormant supply re-entering circulation signals that the selling pressure has run its course, a pattern that often precedes a rebound.

US CPI data set to show inflation at three-year high in May, backing Fed hawkish tilt

The US Bureau of Labor Statistics will publish the May Consumer Price Index (CPI) data on Wednesday. The report is expected to show another step up in consumer inflation, driven by the persistently high Oil prices due to the ongoing crisis in the Middle East.

The US economy defies the rules: 100 days into the Oil shock and the recession signal is still missing

More than three months after the start of the Iran war and the resulting disruption to global energy markets, the US economy continues to display remarkable resilience. The conflict has triggered a sharp rise in Oil prices, reignited inflationary pressures and fueled widespread concerns about a potential economic slowdown.