Silver Price Analysis: XAG/USD consolidates the pullback from 7.5-year highs of $29.86
- Silver trapped between two key barriers hourly chart.
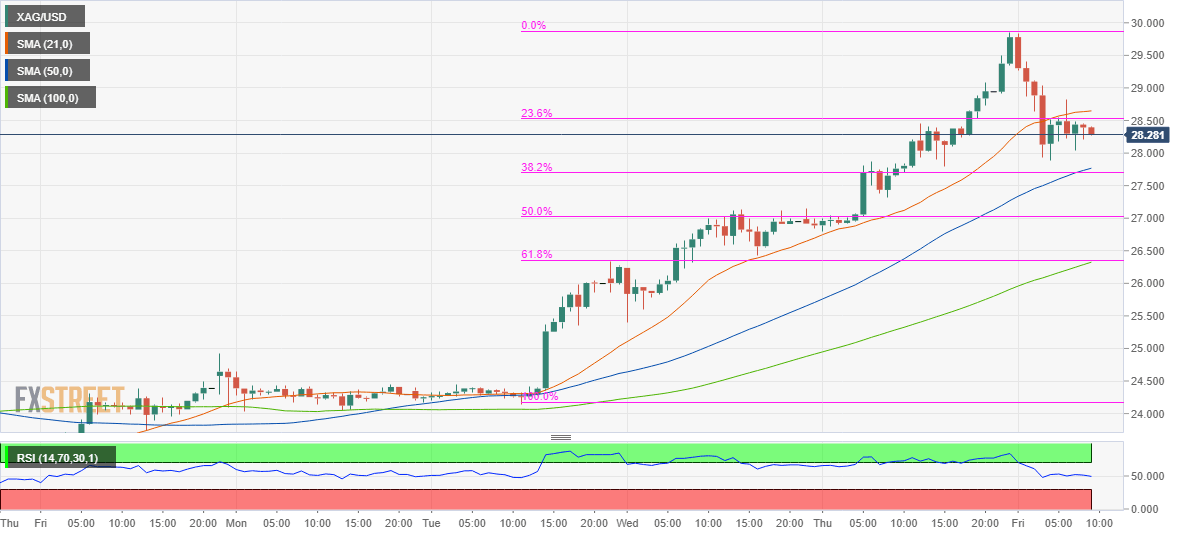
- Hourly RSI has turned flat while steadying at midline.
- Downside appears more compelling in the near-term.

Silver (XAG/USD) extended the ongoing relentless rally and recorded fresh 7.5-year highs at $29.86 in the Asian trades before correcting $2 to $$27.88.
The spot remains in a consolidative mode, with the upside attempts capped near $28.60/80 region, which is the confluence of the 21-hourly Simple Moving Average (HMA) and 23.6% Fibonacci (Fib) Retracement of the fresh rally to multi-year tops seen from August 4.
A sustained break above the 21-HMA could trigger a renewed upside towards the $29.85/30 levels.
Alternatively, to the downside, powerful support awaits at $27.70, the convergence of the 50-HMA and 38.2% Fib of the same advance.
The Fib 50% level at $27.02 will offer the next cushion should the selling pressure intensify.
The hourly Relative Strength Index (RSI) holds steady at the midline, suggesting a lack of clear directional bias. However, with the corrective pullback and overbought conditions on the daily chart, the downside appears more compelling.
Silver: XAG/USD hourly chart
Silver additional levels
Author

Dhwani Mehta
FXStreet
Residing in Mumbai (India), Dhwani is a Senior Analyst and Manager of the Asian session at FXStreet. She has over 10 years of experience in analyzing and covering the global financial markets, with specialization in Forex and commodities markets.


