Silver Price Analysis: XAG/USD bulls challenge a key hurdle near $28.25-30 region
- Silver scaled higher for the third consecutive session on Friday and jumped to over one-week tops.
- Bulls now await a sustained move beyond the $28.30 region before positioning for any further gains.

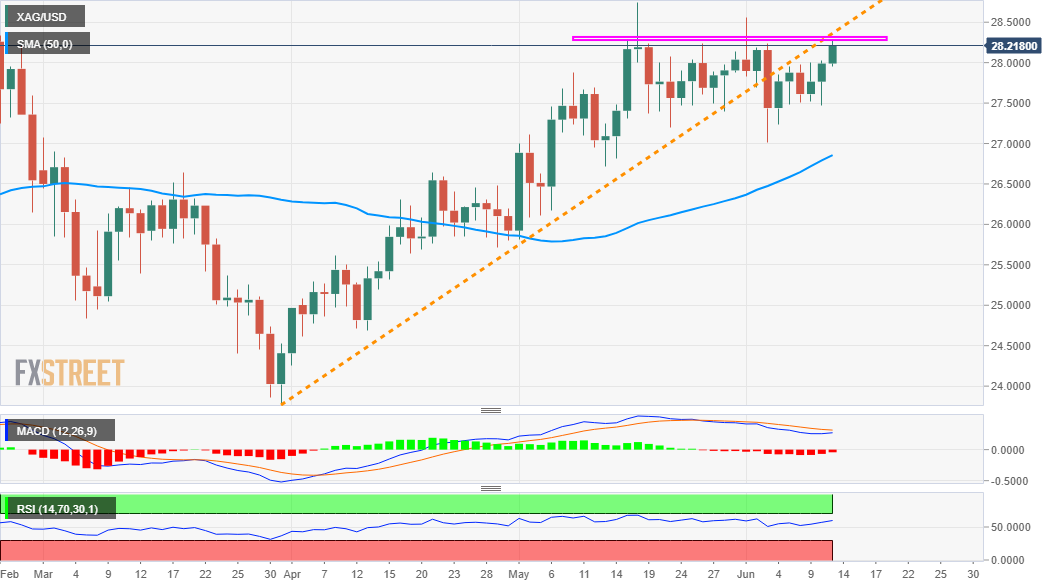
Silver built on the previous day's goodish bounce from weekly lows and gained some follow-through traction on the last trading day of the week. This marked the third consecutive day of a positive move and pushed the commodity to one-and-half-week tops, around the $28.25-30 area during the early European session.
The mentioned region marks a heavy supply zone and coincides with a short-term ascending trend-line support breakpoint. A sustained move beyond will be seen as a fresh trigger for bullish traders and set the stage for an extension of the recent bounce from the vicinity of the $27.00 mark, or monthly lows touched last Thursday.
Meanwhile, technical indicators on the daily chart are holding comfortably in the bullish territory and support prospects for additional gains. That said, oscillators on hourly charts are already flashing slightly overbought conditions and warrant some caution before positioning for any further appreciating move.
Hence, bulls are likely to wait for some follow-through buying beyond the $28.25-30 confluence hurdle. Sustained strength above has the potential to push the XAG/USD towards monthly tops, around the $28.75 region, en-route the $29.00 mark. The next relevant barrier is pegged near the $29.40-50 region ahead of the key $30.00 psychological mark.
On the flip side, the weekly trading range resistance breakpoint, around the $28.00-$27.90 region now seems to protect the immediate downside. Any subsequent decline might still be seen as a buying opportunity and remain limited near the overnight lows, around the $27.40 region, which should now act as a strong base for the XAG/USD.
XAG/USD daily chart
Technical levels to watch
Author

Haresh Menghani
FXStreet
Haresh Menghani is a detail-oriented professional with 10+ years of extensive experience in analysing the global financial markets.
















