- Silver finds support near mid-$24.00s and reverses an intraday dip to over a one-week low.
- The mixed oscillators on daily/hourly charts warrant caution for aggressive bullish traders.
- A convincing break below the 200-day SMA is needed to negate the near-term positive bias.
Silver rebounds from over a one-week low touched this Monday and trades with a mild positive bias, around the $24.65 region during the early European session. The white metal, for now, seems to have stalled a two-day corrective decline from the $24.25 area, or its highest level since May 11 set last Thursday.
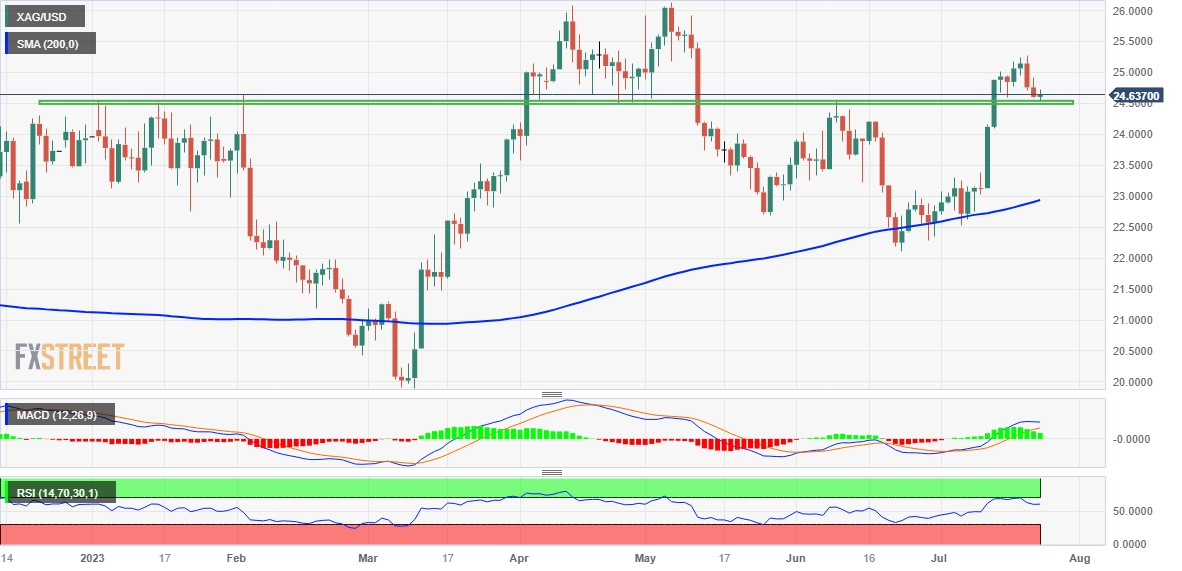
From a technical perspective, the XAG/USD manages to defend the $24.50 strong horizontal resistance breakpoint, now turned support. The said area should now act as a pivotal point, which if broken decisively might prompt some technical selling and drag Silver towards the $24.00 mark. The downward trajectory could get extended further towards the $23.65-$23.60 support en route to the $23.20-$23.15 region.
Some follow-through selling, leading to a subsequent fall below the $23.00 round figure, which nears the very important 200-day Simple Moving Average (SMA), could negate any positive outlook and shift the near-term bias in favour of bearish traders. The XAG/USD might then turn vulnerable to accelerate the fall below the $22.75-$22.70 area, towards challenging the multi-month low, around the $22.15-$22.10 area.
Meanwhile, oscillators on the daily chart are holding comfortably in the positive territory and favour bullish traders. That said, technical indicators on hourly charts are yet to confirm the bullish outlook and warrant caution before positioning for a further intraday appreciating move. Hence, any subsequent move up might attract some sellers near the $25.00 psychological mark and remain capped near last week's swing high, around the $25.25 area.
Some follow-through buying, however, should allow the XAG/USD to surpass the $25.50-$25.55 intermediate hurdle and aim to reclaim the $26.00 round figure. This is closely followed by the YTD peak, around the $26.10-$26.15 area touched in May, which if cleared will set the stage for an extension of the recent upward trajectory witnessed over the past month or so.
Silver daily chart
Key levels to watch
Information on these pages contains forward-looking statements that involve risks and uncertainties. Markets and instruments profiled on this page are for informational purposes only and should not in any way come across as a recommendation to buy or sell in these assets. You should do your own thorough research before making any investment decisions. FXStreet does not in any way guarantee that this information is free from mistakes, errors, or material misstatements. It also does not guarantee that this information is of a timely nature. Investing in Open Markets involves a great deal of risk, including the loss of all or a portion of your investment, as well as emotional distress. All risks, losses and costs associated with investing, including total loss of principal, are your responsibility. The views and opinions expressed in this article are those of the authors and do not necessarily reflect the official policy or position of FXStreet nor its advertisers. The author will not be held responsible for information that is found at the end of links posted on this page.
If not otherwise explicitly mentioned in the body of the article, at the time of writing, the author has no position in any stock mentioned in this article and no business relationship with any company mentioned. The author has not received compensation for writing this article, other than from FXStreet.
FXStreet and the author do not provide personalized recommendations. The author makes no representations as to the accuracy, completeness, or suitability of this information. FXStreet and the author will not be liable for any errors, omissions or any losses, injuries or damages arising from this information and its display or use. Errors and omissions excepted.
The author and FXStreet are not registered investment advisors and nothing in this article is intended to be investment advice.
Recommended content
Editors’ Picks
EUR/USD clings to gains above 1.0850 after US inflation data
EUR/USD trades in positive territory above 1.0850 in the American session on Friday. The US Dollar struggles to preserve its strength following the April PCE inflation data and helps the pair hold its ground heading into the weekend.
GBP/USD retreats from 1.2765, holds on to modest gains
GBP/USD posted a two-day high peat at 1.2765 in the American session, as US data showed that the core PCE inflation held steady at 2.8% on a yearly basis in April. The pair retreated afterwards as risk aversion triggered US Dollar demand.
Gold falls towards $2,330 as the mood sours
US inflation-related data took its toll on financial markets. Wall Street turned south after the opening and without signs of easing price pressures in the world’s largest economy. The US Dollar takes the lead in a risk-averse environment.
Here’s why Chainlink price could crash 15% despite spike in social volume Premium
Chainlink price has flashed multiple sell signals after its recent climb, hinting at a short-term correction. This signal comes despite a double-digit growth in its social volume. LINK bulls need to exercise caution as this forecast is backed by on-chain metrics.
Week ahead – ECB rate cut might get eclipsed by BoC surprise and NFP report
ECB set to slash rates on Thursday, focus on forward guidance. But will the BoC take the lead when it meets on Wednesday? US jobs report eyed on Friday as Fed unyielding on cuts. OPEC+ might extend some output reductions into 2025.