Silver Price Analysis: XAG/USD bears flex muscles within fortnight-old triangle, $23.50 is the key


  • Silver price remains pressured for the second consecutive day within bearish triangle.
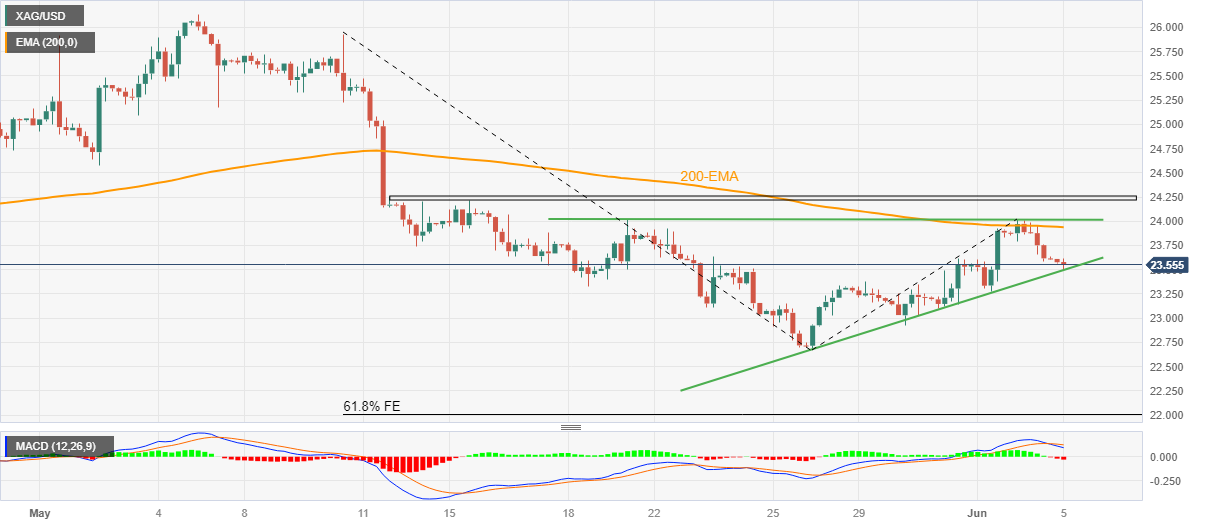
  • Failure to cross 200-EMA, bearish MACD signals favor XAG/USD sellers.
  • Bulls need validation from $24.25 to retake control.


Silver Price (XAG/USD) stays depressed around the intraday low of $23.50 heading into Monday’s European session. In doing so, the bright metal prods the bottom line of a two-week-old ascending triangle while extending the previous day’s pullback from the 200-bar Exponential Moving Average (EMA).

Apart from the failure to cross the key EMA and the existence of the bearish chart pattern, the downbeat MACD signals also lure the XAG/USD sellers.

However, a clear break of $23.50 becomes necessary to confirm the bearish chart formation suggesting a theoretical fall toward $22.20.

That said, the previous monthly low of around $22.70 may act as an extra filter towards the theoretical target whereas the 61.8% Fibonacci Expansion (FE) of its May 10 to June 02 moves, near $22.00, can prod the Silver bears afterward.

On the flip side, a recovery moves not only needs validation from the 200-EMA hurdle of around $23.95 but also needs to defy the triangle formation by crossing the stated pattern’s top line, close to $24.00 by the press time.

Even so, a one-month-old horizontal resistance area around $24.25 can challenge the XAG/USD bulls before giving them control.

Silver Price: Four-hour chart

Trend: Further downside expected

Additional important levels

Overview
Today last price 23.53
Today Daily Change -0.08
Today Daily Change % -0.34%
Today daily open 23.61
 
Trends
Daily SMA20 23.86
Daily SMA50 24.45
Daily SMA100 23.36
Daily SMA200 22.12
 
Levels
Previous Daily High 24.02
Previous Daily Low 23.58
Previous Weekly High 24.02
Previous Weekly Low 22.93
Previous Monthly High 26.14
Previous Monthly Low 22.68
Daily Fibonacci 38.2% 23.75
Daily Fibonacci 61.8% 23.85
Daily Pivot Point S1 23.45
Daily Pivot Point S2 23.3
Daily Pivot Point S3 23.01
Daily Pivot Point R1 23.9
Daily Pivot Point R2 24.18
Daily Pivot Point R3 24.34


Share: Feed news

Information on these pages contains forward-looking statements that involve risks and uncertainties. Markets and instruments profiled on this page are for informational purposes only and should not in any way come across as a recommendation to buy or sell in these assets. You should do your own thorough research before making any investment decisions. FXStreet does not in any way guarantee that this information is free from mistakes, errors, or material misstatements. It also does not guarantee that this information is of a timely nature. Investing in Open Markets involves a great deal of risk, including the loss of all or a portion of your investment, as well as emotional distress. All risks, losses and costs associated with investing, including total loss of principal, are your responsibility. The views and opinions expressed in this article are those of the authors and do not necessarily reflect the official policy or position of FXStreet nor its advertisers. The author will not be held responsible for information that is found at the end of links posted on this page.

If not otherwise explicitly mentioned in the body of the article, at the time of writing, the author has no position in any stock mentioned in this article and no business relationship with any company mentioned. The author has not received compensation for writing this article, other than from FXStreet.

FXStreet and the author do not provide personalized recommendations. The author makes no representations as to the accuracy, completeness, or suitability of this information. FXStreet and the author will not be liable for any errors, omissions or any losses, injuries or damages arising from this information and its display or use. Errors and omissions excepted.

The author and FXStreet are not registered investment advisors and nothing in this article is intended to be investment advice.

Recommended content


Recommended content

Editors’ Picks

EUR/USD edges lower toward 1.0700 post-US PCE

EUR/USD edges lower toward 1.0700 post-US PCE

EUR/USD stays under modest bearish pressure but manages to hold above 1.0700 in the American session on Friday. The US Dollar (USD) gathers strength against its rivals after the stronger-than-forecast PCE inflation data, not allowing the pair to gain traction.

EUR/USD News

GBP/USD retreats to 1.2500 on renewed USD strength

GBP/USD retreats to 1.2500 on renewed USD strength

GBP/USD lost its traction and turned negative on the day near 1.2500. Following the stronger-than-expected PCE inflation readings from the US, the USD stays resilient and makes it difficult for the pair to gather recovery momentum.

GBP/USD News

Gold struggles to hold above $2,350 following US inflation

Gold struggles to hold above $2,350 following US inflation

Gold turned south and declined toward $2,340, erasing a large portion of its daily gains, as the USD benefited from PCE inflation data. The benchmark 10-year US yield, however, stays in negative territory and helps XAU/USD limit its losses. 

Gold News

Bitcoin Weekly Forecast: BTC’s next breakout could propel it to $80,000 Premium

Bitcoin Weekly Forecast: BTC’s next breakout could propel it to $80,000

Bitcoin’s recent price consolidation could be nearing its end as technical indicators and on-chain metrics suggest a potential upward breakout. However, this move would not be straightforward and could punish impatient investors. 

Read more

Week ahead – Hawkish risk as Fed and NFP on tap, Eurozone data eyed too

Week ahead – Hawkish risk as Fed and NFP on tap, Eurozone data eyed too

Fed meets on Wednesday as US inflation stays elevated. Will Friday’s jobs report bring relief or more angst for the markets? Eurozone flash GDP and CPI numbers in focus for the Euro.

Read more

Forex MAJORS

Cryptocurrencies

Signatures