Silver Price Analysis: Mildly bid above $24.00 after Thursday’s Dragonfly doji


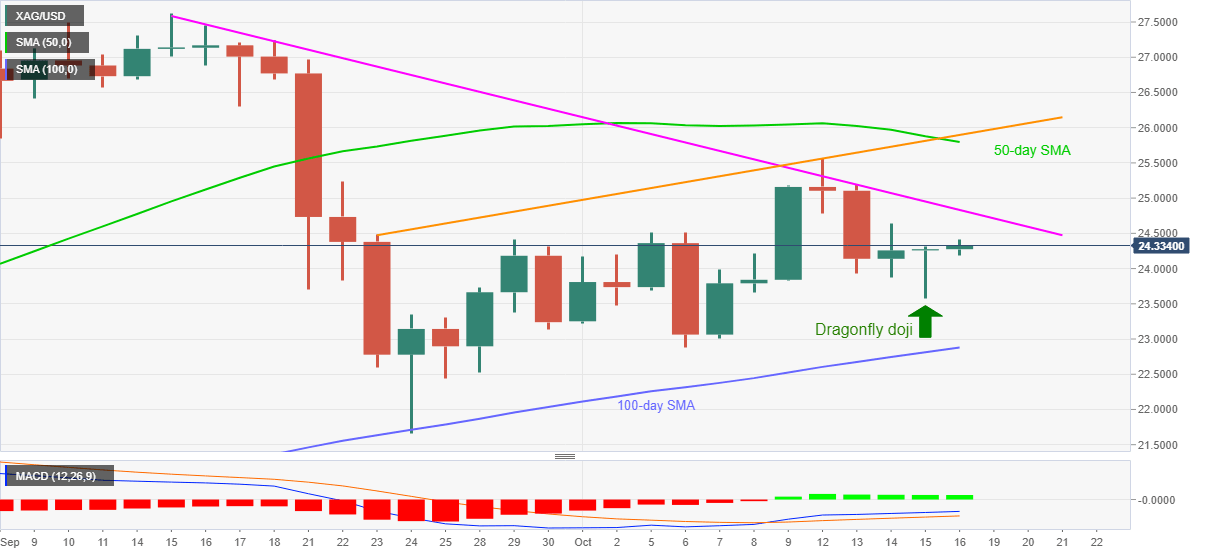
  • Silver probes intraday high of $24.41 after posting a bullish candlestick on D1 the previous day.
  • Sustained trading below 1.5-month-old falling trend line favors the sellers.
  • 50-day SMA and a three-week-old rising line add to the upside barrier.

Silver prices keep recovery moves, portrayed during Thursday’s US session, while rising from $24.33 to $24.34 during Friday’s Asian trading.

In doing so, the white metal respects the Dagonfly Doji, bullish candlestick, formation on the daily (D1) chart for the previous day while also cheering bullish MACD. On the contrary, the bears can be hopeful while watching a downward sloping trend line from September 01.

As a result, silver sellers can only likely to retake controls if successfully breaking the $24.00 round-figure ahead of visiting the confluence of 100-day SMA and the monthly low near $22.85/90.

Additionally, the $23.60 and the $23.00 may act as buffers during the fall that can attack the September month’s low of $21.65 on the downside break of $22.85 support.

On the flip side, a six-week-old resistance line near $24.65 offers immediate resistance to the bullion buyers before directing them to the monthly high of $25.56.

However, no further advances can be expected beyond $25.56 unless the quote manages to cross the 50-day SMA level of $25.80, followed by a successful clearance of an ascending trend line from September 23, at $25.90.

Silver daily chart

Trend: Pullback expected

aDDITIONAL IMPORTANT LEVELS

Overview
Today last price 24.33
Today Daily Change 0.05
Today Daily Change % 0.21%
Today daily open 24.28
 
Trends
Daily SMA20 24.07
Daily SMA50 25.88
Daily SMA100 22.81
Daily SMA200 19.56
 
Levels
Previous Daily High 24.31
Previous Daily Low 23.57
Previous Weekly High 25.18
Previous Weekly Low 22.88
Previous Monthly High 28.9
Previous Monthly Low 21.66
Daily Fibonacci 38.2% 24.03
Daily Fibonacci 61.8% 23.85
Daily Pivot Point S1 23.79
Daily Pivot Point S2 23.31
Daily Pivot Point S3 23.05
Daily Pivot Point R1 24.53
Daily Pivot Point R2 24.79
Daily Pivot Point R3 25.28


Share: Feed news

Information on these pages contains forward-looking statements that involve risks and uncertainties. Markets and instruments profiled on this page are for informational purposes only and should not in any way come across as a recommendation to buy or sell in these assets. You should do your own thorough research before making any investment decisions. FXStreet does not in any way guarantee that this information is free from mistakes, errors, or material misstatements. It also does not guarantee that this information is of a timely nature. Investing in Open Markets involves a great deal of risk, including the loss of all or a portion of your investment, as well as emotional distress. All risks, losses and costs associated with investing, including total loss of principal, are your responsibility. The views and opinions expressed in this article are those of the authors and do not necessarily reflect the official policy or position of FXStreet nor its advertisers. The author will not be held responsible for information that is found at the end of links posted on this page.

If not otherwise explicitly mentioned in the body of the article, at the time of writing, the author has no position in any stock mentioned in this article and no business relationship with any company mentioned. The author has not received compensation for writing this article, other than from FXStreet.

FXStreet and the author do not provide personalized recommendations. The author makes no representations as to the accuracy, completeness, or suitability of this information. FXStreet and the author will not be liable for any errors, omissions or any losses, injuries or damages arising from this information and its display or use. Errors and omissions excepted.

The author and FXStreet are not registered investment advisors and nothing in this article is intended to be investment advice.

Recommended content


Recommended content

Editors’ Picks

EUR/USD holds below 1.0750 ahead of key US data

EUR/USD holds below 1.0750 ahead of key US data

EUR/USD trades in a tight range below 1.0750 in the European session on Friday. The US Dollar struggles to gather strength ahead of key PCE Price Index data, the Fed's preferred gauge of inflation, and helps the pair hold its ground. 

EUR/USD News

GBP/USD consolidates above 1.2500, eyes on US PCE data

GBP/USD consolidates above 1.2500, eyes on US PCE data

GBP/USD fluctuates at around 1.2500 in the European session on Friday following the three-day rebound. The PCE inflation data for March will be watched closely by market participants later in the day.

GBP/USD News

Gold clings to modest daily gains at around $2,350

Gold clings to modest daily gains at around $2,350

Gold stays in positive territory at around $2,350 after closing in positive territory on Thursday. The benchmark 10-year US Treasury bond yield edges lower ahead of US PCE Price Index data, allowing XAU/USD to stretch higher.

Gold News

Bitcoin Weekly Forecast: BTC’s next breakout could propel it to $80,000 Premium

Bitcoin Weekly Forecast: BTC’s next breakout could propel it to $80,000

Bitcoin’s recent price consolidation could be nearing its end as technical indicators and on-chain metrics suggest a potential upward breakout. However, this move would not be straightforward and could punish impatient investors. 

Read more

US core PCE inflation set to signal firm price pressures as markets delay Federal Reserve rate cut bets

US core PCE inflation set to signal firm price pressures as markets delay Federal Reserve rate cut bets

The core PCE Price Index, which excludes volatile food and energy prices, is seen as the more influential measure of inflation in terms of Fed positioning. The index is forecast to rise 0.3% on a monthly basis in March, matching February’s increase. 

Read more

Forex MAJORS

Cryptocurrencies

Signatures