- Crypto stocks recover as Bitcoin stages rebound.
- Elon Musk reportedly talking to miners about energy usage.
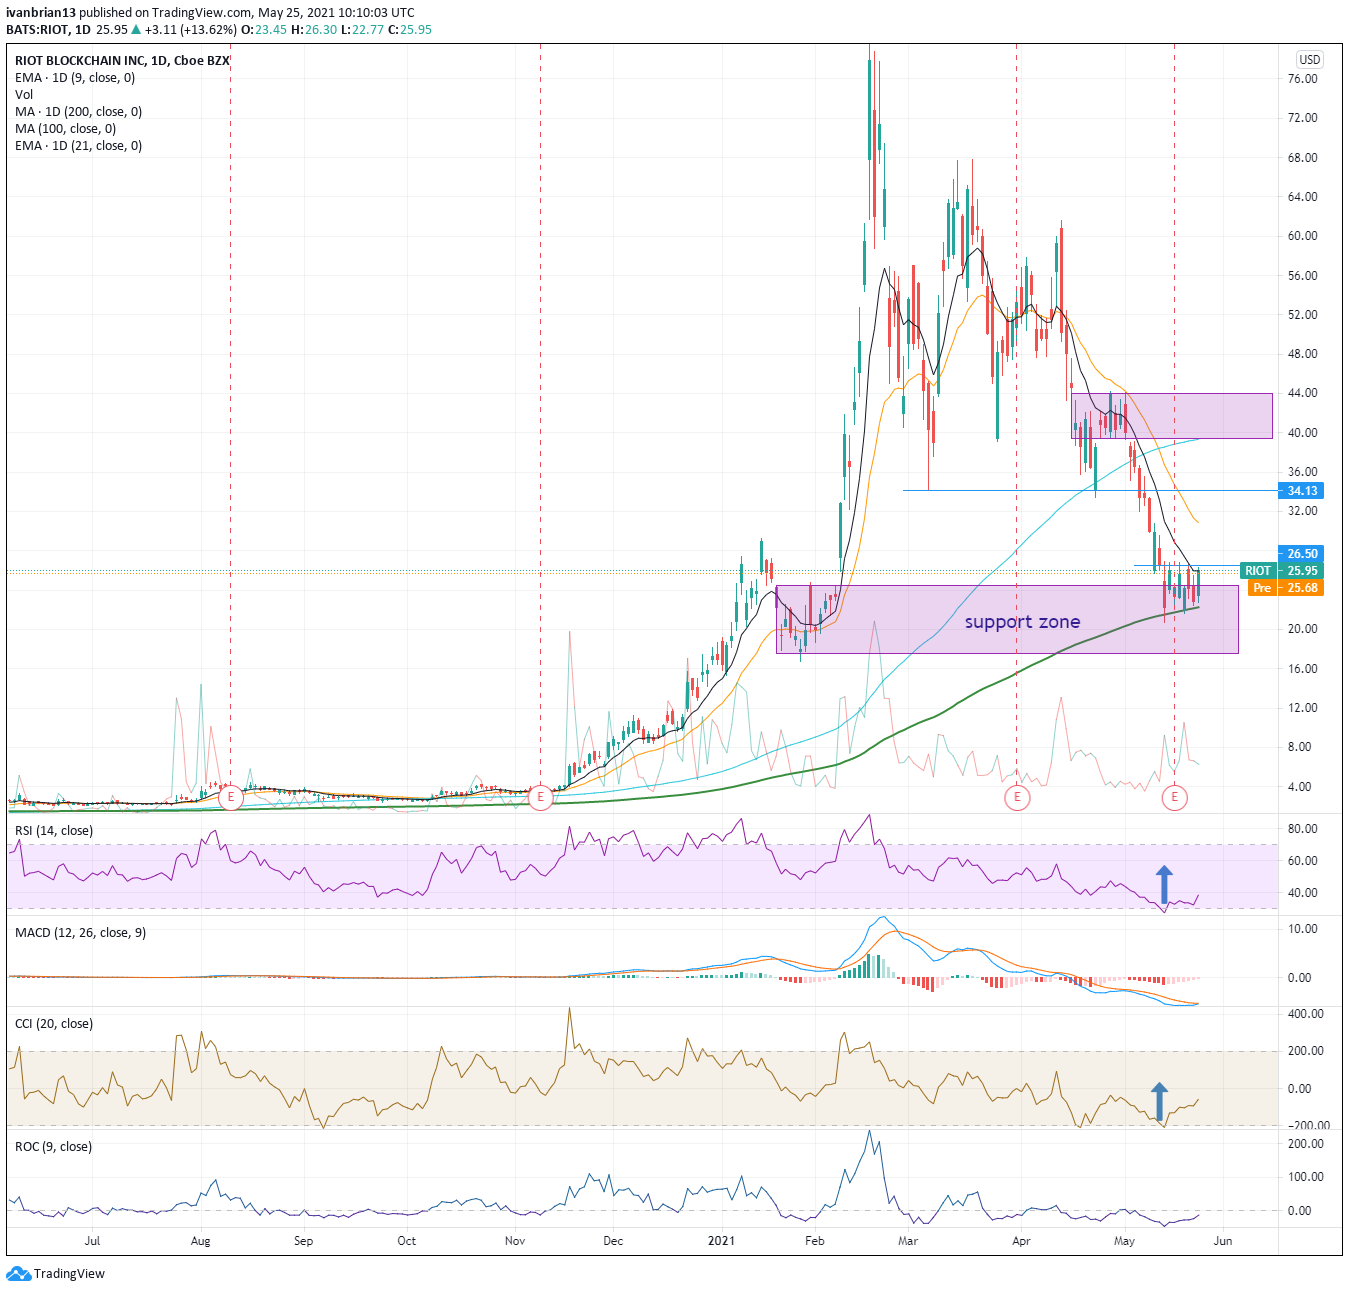
- RIOT shares bounce from 200-day moving average.
Who says technical analysis does not work. RIOT shares have exhibited textbook testing by rejecting support from the 200-day moving average. The woes of Bitcoin last week are well documented and saw most crypto stocks suffer heavy losses. RIOT was no exception but steadied insight of the 200-day moving average. Bitcoin managed to steady the ship and bounce towards $40,000 and now Bitcoin miners have come together to discuss energy consumption, further boosting sentiment in the crypto leader and in crypto stocks.
RIOT Blockchain as the name suggests is involved in the blockchain system and is primarily a Bitcoin miner. RIOT also has an interest in Coinsquare Ltd in Canada, a digital currency exchange.
RIOT stock forecast
RIOT shares have been under serious pressure as the retail meme stock effect calmed down post the whole GameStop frenzy. Crypto stocks were caught in the frenzy as the dual effect of retail money and Bitcoin bouncing led to serious gains for many crypto stocks. Too serious as it turned out with RIOT dropping from a February high of nearly $80 to current levels around $25.
While such a strong move may usually not see some key technical levels in play, RIOT exhibited some textbook chart patterns. In particular, it is clearly visible how the 200-day moving average stopped the fall on a number of occasions and allowed RIOT shares to form a base. It is also clear that the fall in RIOT stalled at a previous consolidation area. This was a more important consolidation area than usual as RIOT exploded from this area back in early February.
Adding further to the support zone and the 200-day moving average is the fact that both the Relative Strength Index (RSI) and the Commodity Channel Index (CCI) flagged oversold conditions recently. Both RSI and CCI are momentum oscillators that try to identify when prices have moved too far in one direction. They are far from perfect indicators (none are) but a combination of two gives a stronger signal.
Finally, RIOT reported earnings on May 17 which missed expectations. Earnings per share (EPS) came in at $0.09 versus an expected $0.20, which turns into a 55% miss. However RIOT shares did not trade much lower post the earnings release as we can see from the chart, the E dotted line showing the earnings release.
The first resistance for RIOT to target to confirm the arguments made above for forming a base is to attack the $26.50 high from multiple days last week and really RIOT would need to break through this level sooner rather than later. A consolidation phase such as the current one eventually leads to a breakout higher or lower at some stage. The longer RIOT fails to break this $26.50 level, the more likely it is to retest the 200-day MA support at $22.25. A break of $26.50 sees more resistance at $34.13 and then a strong resistance zone identified above $40. The key support to hold is the 200-day moving average.
| Support | 22.25 200-day MA | 20 | 17.55 | |
| Resistance | 26.50 | 34.13 | 40 | 44 |
At the time of writing, the author has no position in any stock mentioned in this article and no business relationship with any company mentioned. The author has not received compensation for writing this article, other than from FXStreet.
This article is for information purposes only. The author and FXStreet are not registered investment advisors and nothing in this article is intended to be investment advice. It is important to perform your own research before making any investment and take independent advice from a registered investment advisor.
FXStreet and the author do not provide personalized recommendations. The author makes no representations as to accuracy, completeness, or the suitability of this information. FXStreet and the author will not be liable for any errors, omissions or any losses, injuries or damages arising from this information and its display or use. The author will not be held responsible for information that is found at the end of links posted on this page.
Errors and omissions excepted.
Information on these pages contains forward-looking statements that involve risks and uncertainties. Markets and instruments profiled on this page are for informational purposes only and should not in any way come across as a recommendation to buy or sell in these assets. You should do your own thorough research before making any investment decisions. FXStreet does not in any way guarantee that this information is free from mistakes, errors, or material misstatements. It also does not guarantee that this information is of a timely nature. Investing in Open Markets involves a great deal of risk, including the loss of all or a portion of your investment, as well as emotional distress. All risks, losses and costs associated with investing, including total loss of principal, are your responsibility. The views and opinions expressed in this article are those of the authors and do not necessarily reflect the official policy or position of FXStreet nor its advertisers. The author will not be held responsible for information that is found at the end of links posted on this page.
If not otherwise explicitly mentioned in the body of the article, at the time of writing, the author has no position in any stock mentioned in this article and no business relationship with any company mentioned. The author has not received compensation for writing this article, other than from FXStreet.
FXStreet and the author do not provide personalized recommendations. The author makes no representations as to the accuracy, completeness, or suitability of this information. FXStreet and the author will not be liable for any errors, omissions or any losses, injuries or damages arising from this information and its display or use. Errors and omissions excepted.
The author and FXStreet are not registered investment advisors and nothing in this article is intended to be investment advice.
Recommended content
Editors’ Picks
EUR/USD retreats toward 1.0850 on modest USD recovery

EUR/USD stays under modest bearish pressure and trades in negative territory at around 1.0850 after closing modestly lower on Thursday. In the absence of macroeconomic data releases, investors will continue to pay close attention to comments from Federal Reserve officials.
GBP/USD holds above 1.2650 following earlier decline

GBP/USD edges higher after falling to a daily low below 1.2650 in the European session on Friday. The US Dollar holds its ground following the selloff seen after April inflation data and makes it difficult for the pair to extend its rebound. Fed policymakers are scheduled to speak later in the day.
Gold climbs to multi-week highs above $2,400

Gold gathered bullish momentum and touched its highest level in nearly a month above $2,400. Although the benchmark 10-year US yield holds steady at around 4.4%, the cautious market stance supports XAU/USD heading into the weekend.
Chainlink social dominance hits six-month peak as LINK extends gains
-637336005550289133_XtraSmall.jpg)
Chainlink (LINK) social dominance increased sharply on Friday, exceeding levels seen in the past six months, along with the token’s price rally that started on Wednesday.
Week ahead: Flash PMIs, UK and Japan CPIs in focus – RBNZ to hold rates

After cool US CPI, attention shifts to UK and Japanese inflation. Flash PMIs will be watched too amid signs of a rebound in Europe. Fed to stay in the spotlight as plethora of speakers, minutes on tap.