Quarterly earnings preview: Alibaba (BABA Stcok) Eli Lilly (LLY Stock) and Fidelity (FIS Stock)

Alibaba Group (#Alibaba), a Chinese multinational technology company with a market cap of over $530B, specializing mainly in core commerce (retail and wholesale operating platform), cloud computing (big data analytics, machine learning platform, database, storage, and content delivery network, security, management, and application), and digital media and entertainment (Youku, Tudouetc), is scheduled to announce its earnings for the fiscal Quarter ending June 2021 on 3rd August, before market open.
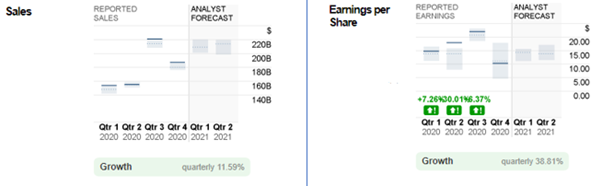
Figure 1: Reported Sales and EPS versus Analyst Forecast for Alibaba, by quarterly and annually
Despite suffering the first-ever losses from operations due to the anti-monopoly fine levied by the government in China, Alibaba Group continued to surpass consensus estimates in many aspects in the quarter ended March 31st this year. This includes annual active consumers and mobile monthly active users (MAUs) exceeding 800 million (an increase of 32 million (q/q) and 85 million (y/y)) and 900 million (an increase of 23 million (q/q) and 79 million (y/y)) respectively, $28.60B in revenue (an increase of 64% compared to the same period last year), as well as non-GAAP net income and diluted earnings per share (EPS) achieving an increase of 18% (y/y) and 12% (y/y). Adjusted EBITDA has also recorded gains of 18% (y/y) to $4.563B.
Market participants remain optimistic over the upcoming quarterly earnings announcement. Consensus estimates for sales stood at 209.1B, up 11.58% (q/q) and 35.96% (y/y) respectively. In addition, EPS is expected to hit $14.32, up 38.76% (q/q), but slightly below the same quarter in the previous year, by 3.37%. Nevertheless, taking into consideration the positive factors such as the strategic business model for consumer growth and retention, a new retail strategy which involves seamlessly online and offline digital commerce infrastructure and high-frequency delivery fulfillment services, improved domestic and international logistics, and consistent growth of international commerce retail business (Lazada, Ali Express) and so on, market participants remain positive towards the outlook of the Alibaba Group.
Even so, it is still important to keep in mind that some negative factors that could provoke international tensions and block the expansion of Chinese tech companies, as well as the company’s rocky political standing which may hinder its future growth, should also not be ignored.
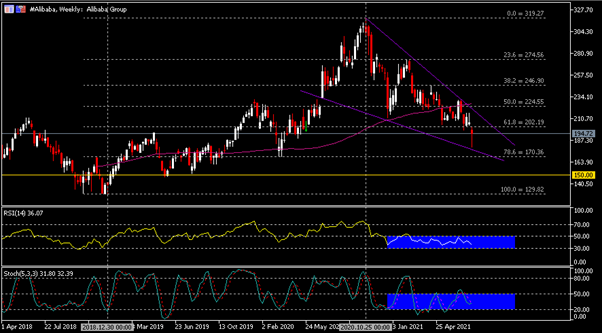
The weekly chart shows that the #Alibaba share price is traded within a descending wedge, leaving the highest point at $319.27 seen on 27th October 2020, and consecutively lower highs at $274.27 (or FR 23.6%) and $230.86 (near FR 50.0% and SMA-100). Breaking below these points, the company’s share price continues its losses to below FR 61.8%, or $202.20. Both RSI and Stochastics Oscillator display that the price remains stable in a range below 50.0, but above the oversold zone.
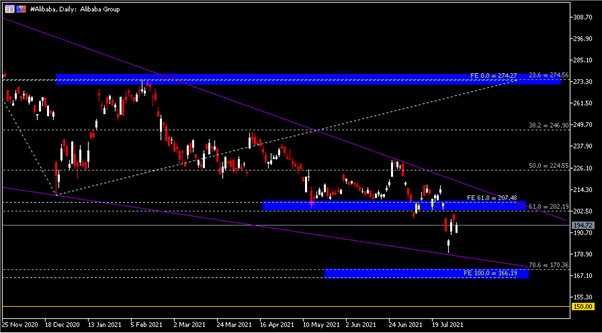
From the Daily chart, the #Alibaba share price remains pressured below resistance zone $202.00 (or FR 61.8%) and $207.50 (FE 61.8%; all FE levels are constructed following connection of the highest point seen last year, $319.27, the subsequent lowest point seen in late December of the same year, $211.19, and a rebound high at $274.27 (also corresponds to the weekly FR 23.6%).
Based on the estimates offered by analysts, the #Alibaba share price is just slightly above the low estimate ($192.33), and over 80% have voted for a “Buy” in a poll since July. If the price breaks above $202.00-$207.50, with a bullish candlestick closing strongly above the upper line of the descending wedge as well, there is potential for the price to extend towards the next resistance $224.50 (FR 50.0%) and $246.90 (FR 38.2%).
Nevertheless, if the said resistance zone remains, $166.20-$170.40 may serve as critical support to watch. A successful bearish breakout will also mean a break to the price structure, thus opening up an opportunity for another slump towards the psychological price level $150.00 and the low seen in May 2019, $147.91.
Eli Lilly
Eli Lilly and Co. (#EliLilly) is an American pharmaceutical company with the profile of a diversified drug that was founded in 1876. Similar to Alibaba Group, it is set to release its earnings report on 3rd August, before the market open.
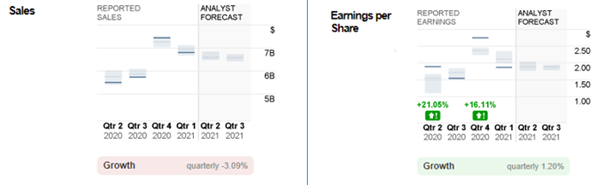
Figure 2: Reported Sales and EPS versus Analyst Forecast for Eli Lilly, by quarterly and annually
In general, Eli Lilly does not seem to be a compelling candidate in terms of sales and EPS growth. In the previous quarter, both reported sales and EPS missed consensus estimates, with the former stood at $6.8B (versus $6.9B) while the latter stood at $1.87 (versus $2.12). Despite being involved in selling a wide range of drugs, lower realized prices driven by increased competition among peers and increased rebates to gain wide commercial access, lower-than-expected demand for its Covid-related drugs, reducing the price in international markets, as well as the continued negative impact from the pandemic, has curbed the company’s growth.
Market expectations remain flat for the upcoming Q2 announcement. Sales is expected to achieve $6.6B, down 2.94% (q/q), but up 20% (y/y); EPS, on the other hand, is expected to hit $1.89, up slightly from the previous quarter by 1.07%, but remaining flat as in the same quarter last year. It is currently ranked as #4 (Sell) by Zacks.
In the near term, following the FDA’s emergency approval to supply a wider range of antibody medicine for Covid-19, the number of sales of these drugs remains on an observation list in which a better-than-consensus performance may improve market sentiment. Any development in the pandemic situation shall also directly affect the company’s performance.
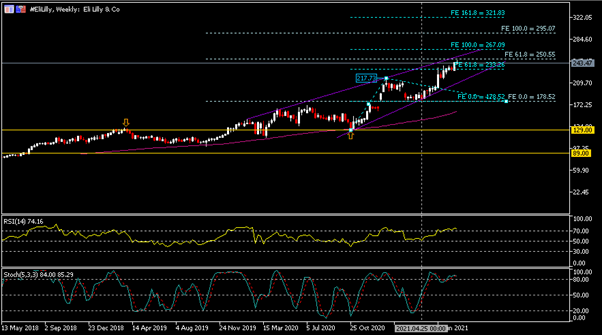
From a technical perspective, the points $101.18 (2019 lows) and $129.16 (the lowest seen in the latter half of 2020), together with January 2021 high $217.73 and the $178.52 (resistance turned support), form bigger and smaller (aqua) Fibonacci expansion trend levels respectively. Currently, the #EliLilly share price is traded within an ascending wedge, slightly below $250 (median estimate of 17 analysts, or bigger FE 61.8%). Breaking above this level, the share price may extend higher to test the two FE 100.0%, first the smaller FE ($267.10) and next to the bigger FE ($295.10) to the high estimate of the analysts, $300.00.
Oscillator indicators in both Weekly and Daily charts display the #EliLilly share price at an overbought zone. The downside risk is that the earnings result will not perform up to par, which may lead to the share price tumbling towards $233.25 (smaller FE 61.8%). Breaking this level may indicate the possibility for the share price to extend its losses towards $217.73 (or January 2021 high), $210.00, and $195.00 (or the low estimate offered by analysts, $190.00).
Fidelity national information services
Fidelity National Information Services, Inc. (#FIS) has been established for over 50 years, engaging in the segments merchant (electronic payments, eCommerce, and mobile wallet), banking (digital solutions, fraud and risk management, payment network, item processing, and output services solutions) and capital markets (buy-and sell-side solutions) in over 140 countries. The company will also release its earnings report for the fiscal quarter ending June 2021 on August 3rd, before the market open.
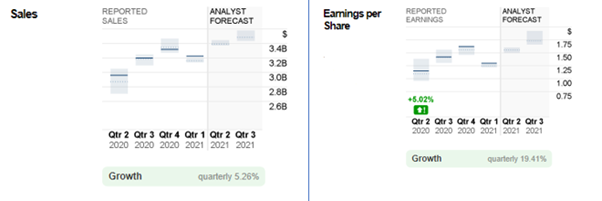
Figure 3: Reported Sales and EPS versus Analyst Forecast for FIS, by quarterly and annually
In Q1 2021, FIS reported sales revenue at $3.2B, slightly down 3% from the previous quarter, but up 5% as compared to Q1 2020. The figure is at par with market expectations. Most of the revenues came from the software license fees and processing, transaction fees, technology, and professional services that it provides.
On the other hand, EPS stood at $1.30, exceeding consensus estimates by $0.05. FIS has been doing well in the last year, with reported sales revenue at 12.6B (same as consensus estimates) and EPS at $5.46 versus consensus estimates at $5.41.
For the upcoming announcement, sales revenue is expected to hit $3.4B, up 6.25% (q/q) and 13.33% (y/y), respectively. As for EPS, according to Estimate Momentum, analysts’ sentiment remains optimistic as it has been projected at $1.55 for the past month and kept unchanged. If this scenario happens, the EPS would be up 19.23% (q/q) and 34.78% (y/y), respectively.
A buy rating is given by a majority of analysts on FIS stocks. Fundamentally speaking, the company is seen as undervalued at a more than 25% discount to the current market price, by using the Discounted Cash Flow (DCF) model. Looking forward, as its cryptocurrency exchange continues to expand, FIS will also benefit from its card-to-crypto processor Worldpay. In addition, its Modern Banking Platform which offers advanced components that serve open, powerful, and scalable banking systems has helped banks to continue staying ahead of market changes. This suggests that market demand towards services offered by the company may increase further in the future, thus benefiting its stock price.

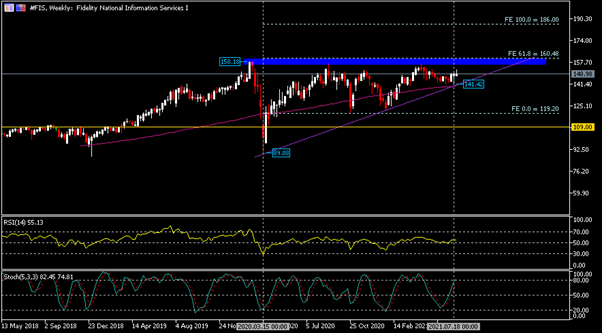
The weekly chart shows that the #FIS share price remains traded within an ascending triangle, with the recent highest point formed at $158.18 seen in the week of 9th February last year. Together with $160.50 (or FE 61.8%), these price levels contributed to major resistance.
In general, $89.88 (lowest low formed on 15th March last year), $121.66 (higher low formed on 24th January this year), and the latest, highest low $141.42 (which also corresponds to 100-SMA) contribute to the three key points which connect together to form an ascending trendline of the triangle. Currently, the company’s share price is traded at the low estimate ($150.00) as offered by 29 analysts. RSI remains neutral (55.13) while Stochastics oscillators approach the overbought zone.
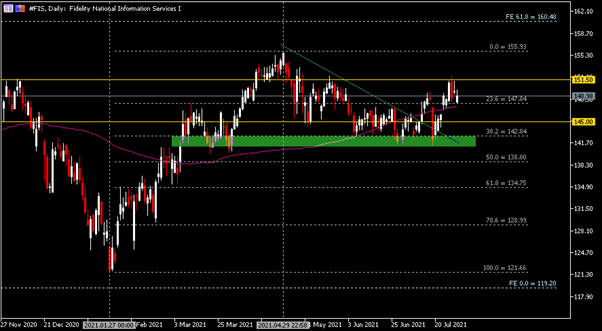
In between FE 0.0% ($119.20) and FE 61.8% ($160.50), prices are subdivided into Fibonacci retracement levels, which extend from the lowest seen in late January ($121.66) to the session high formed in late April ($155.93) this year. The level at which FR 23.6% and SMA-100 meet is the nearest support. If the bears successfully break the support, the next support levels to focus on are $145.00, $141.42 (highest low of weekly ascending triangle structure), $142.85 (FR 38.2%), and $138.80 (FR 50.0%).
At the upside, a break above the resistance $151.50 may indicate the share price will extend its bullish momentum towards the highest point of the year ($155.93), and later on the weekly FE 61.8% ($160.50).
Premium
You have reached your limit of 3 free articles for this month.
Start your subscription and get access to all our original articles.


