Proctor and Gamble stocks momentum trade idea: How to play the long term trend accelerating higher
Introduction
VolatilityMarkets Momentum Trade Idea.
According to AQR the quantitative hedge fund and Yale University, over the past 100 years markets moved in trends. Trends are successive upwards and downwards movements in price that occur at a greater frequency than would be predicted by randomness alone. The following trade idea is a momentum trade idea which takes the assumption that the market will continue moving in the way it has over the previous sessions. momentum trading, is different than trend trading due to the time horizon of the trade as momentum trades will happen intraday or over the course of a single session while trend trading is done over the course of a week or more.
Market summary
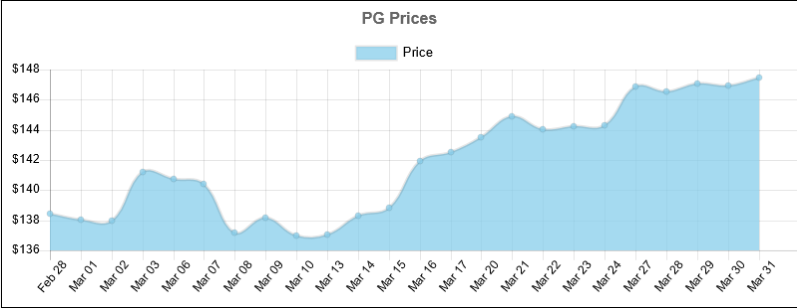
Price
PG last price was $ 147.45.
Trend analysis
In the short term Proctor and Gamble has been accelerating higher. In the long term Proctor and Gamble has been accelerating higher.
Value analysis
Over the past 23 days, the PG price increased 14 days and decreased 9 days.
For every up day, there were 0.64 down days.
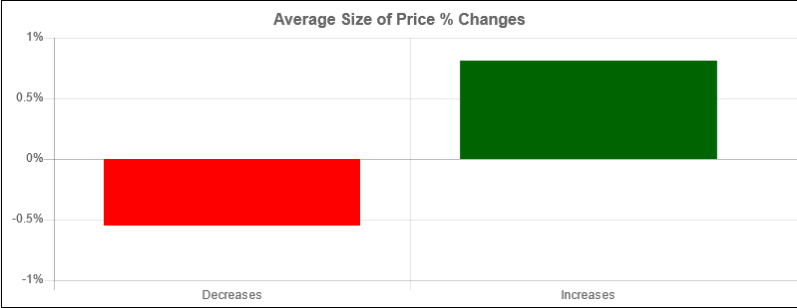
The average return on days where the price increased is 0.8133%.
The average return on days where the price decreased is -0.5522%.
Performance
Over the past 23 Days, the price has increased by 6.5% percent.
Over the past 23 days, the average return per day has been 0.2826% percent.
Trade Idea
Taking into account the long term trend accelerating higher, we propose a long trade idea with an overnight time horizon..
Trend trade idea
Buy $ 247,509 USD of Proctor and Gamble, take profit at $ 148.4688 level with 24.96% odds for a $ 1,710 USD gain, stop out at $ 146.8543 with 50.0% odds for a $ 1,000 USD loss through an overnight time horizon.
Intraday predictions
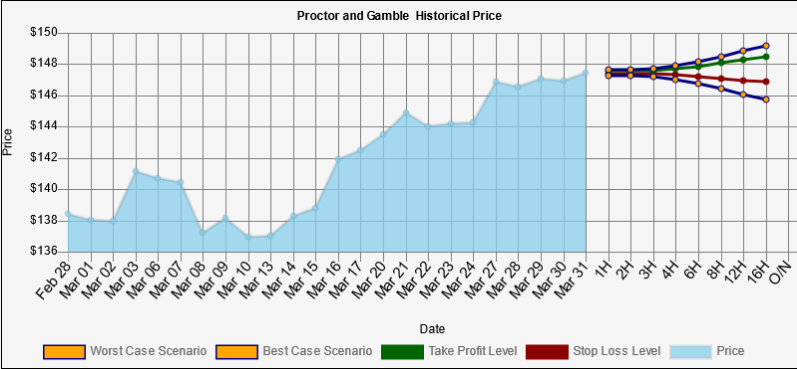
PG trend analysis

Proctor and Gamble last price was $ 147.45. The long term trend accelerating higher is stronger than the short term trend accelerating higher. This trade goes long when price has been moving higher and accelerating over the past 23 days.
Proctor and Gamble value analysis
Over the past 23 days, the Proctor and Gamble price increased 14 days and decreased 9 days. For every up day, there were 0.64 down days. The average return on days where the price increased is 0.8133% The average return on days where the price decreased is -0.5522% Over the past 23 Days, the price has increased by 6.5% percent. Over the past 23 days, the average return per day has been 0.2826% percent.
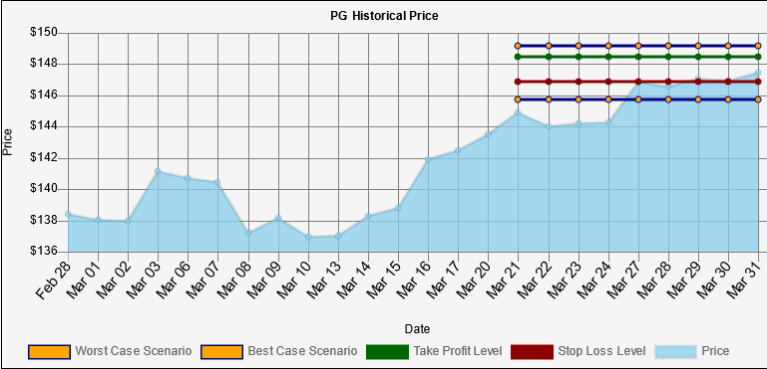
Proctor and Gamble worst/best case scenario analysis
Within 1 week, our worst case scenario where we are 95% certain that this level won't trade for Proctor and Gamble, is $ 145.7105 , and the best case scenario overnight is $ 149.1895 . levels outside of this range are unlikely, but still possible, to trade. We are 50% confident that $ 146.8543 could trade and that $ 148.4688 could trade. These levels are within statistical probability.
Expected range
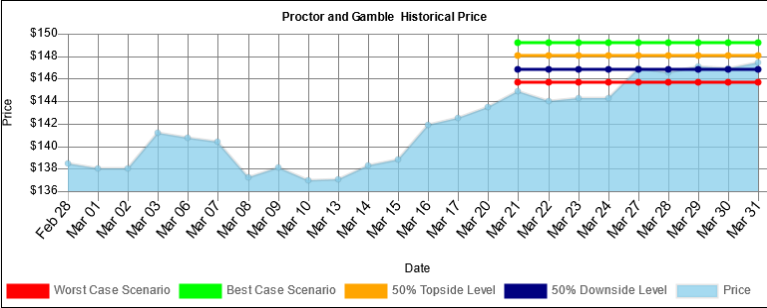
Within 1 week, our worst case scenario where we are 95% certain that this level won't trade for Proctor and Gamble, is $ 145.7105 , and the best case scenario overnight is $ 149.1895 . levels outside of this range are unlikely, but still possible, to trade.
We are 50% confident that $ 146.8543 could trade and that $ 148.4688 could trade. These levels are within statistical probability.
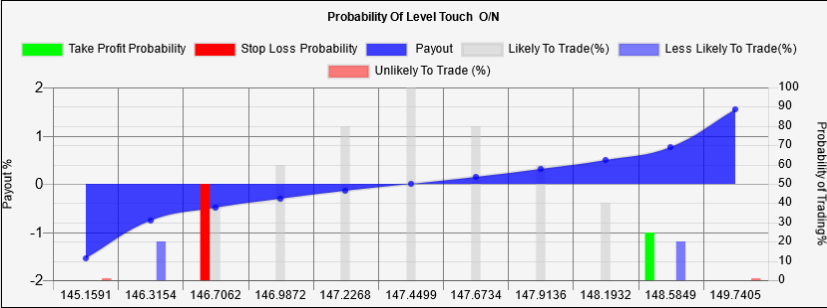
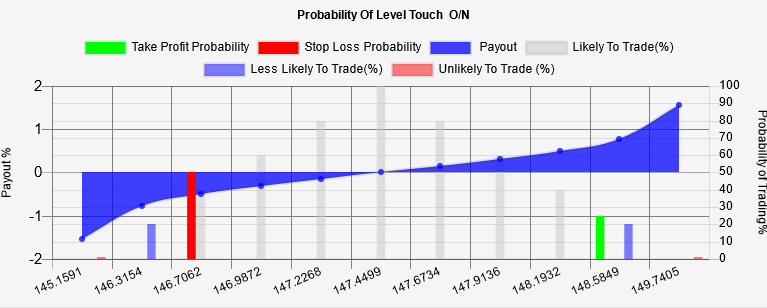
Probability Vs Payout Chart:
This graph contrasts the percentage payout of holding a position vs the probability that the payout occurs. The red and green columns represent the probability of stopping out and taking profit and their associated payouts.
Key Takeaways:
-
Price today $ 147.45.
-
Over the past 23 days, the Proctor and Gamble price increased 14 days and decreased 9 Days.
-
For every up day, there were 0.64 down days.
-
The average return on days where the price increased is 0.8133%.
-
The average return on days where the price decreased is -0.5522%.
-
Over the past 23 Days, the price has increased by 6.5% percent.
-
Over the past 23 days, the average return per day has been 0.2826% percent.
-
Over the past 23 days, The price has on average been accelerating: $ 0.0059 per day higher
-
Over the last session, the price increased by $ 0.53
-
Over the last session, the price increased by 0.3594 %
-
Over the last session, the price accelerated by $ 0.37
Author

Barry Weinstein
Volatility Markets Newswire
Barry Weinstein was a forex derivatives trader at BlueCrest Capital which was one of the largest hedge funds in Europe and then joined Credit Suisse where he assisted in running one of the largest FX Options portfolios in Europe.


