|

Pound Sterling tests the major level of 1.2450

GBP/USD Price Analysis: Rises to near 1.2450 despite the bearish sentiment

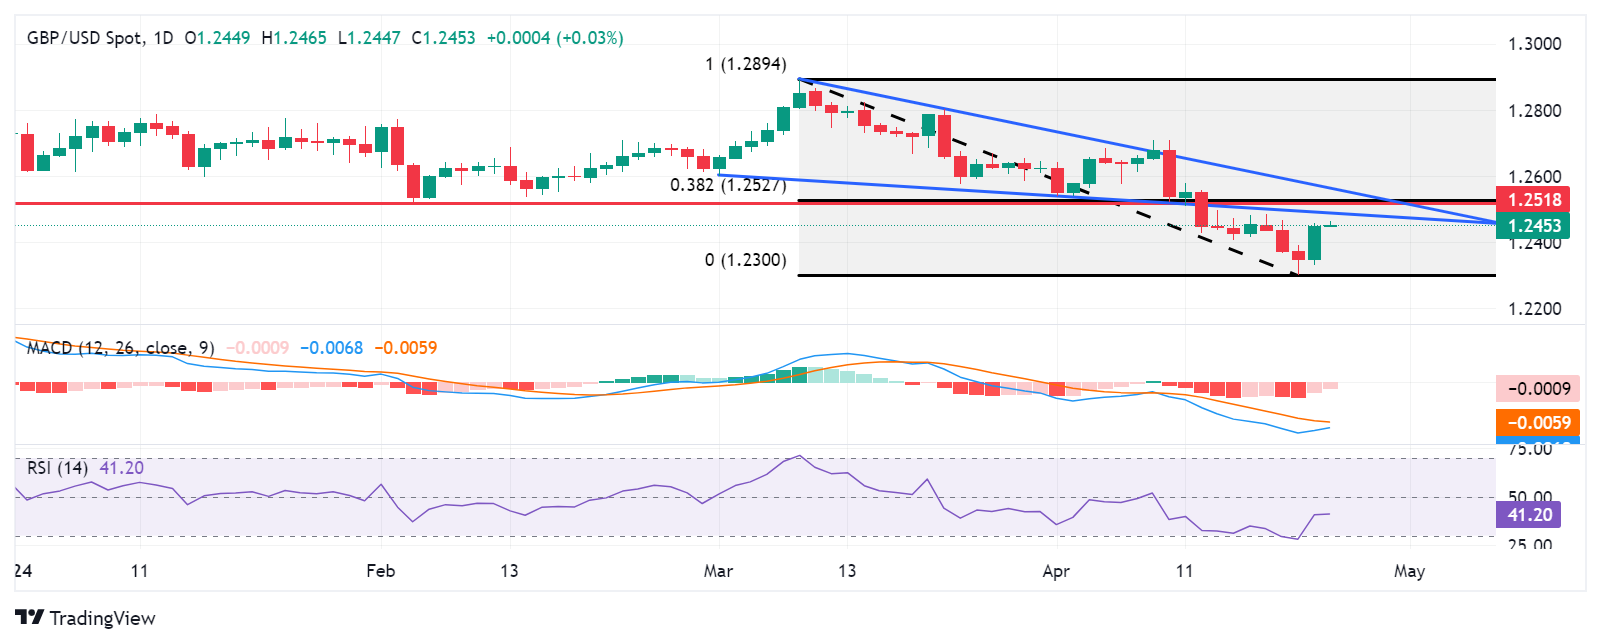
GBP/USD has been on the rise for the second consecutive day, trading around 1.2450 in Asian trading on Wednesday. However, the pair is still below the pullback resistance at 1.2518, which coincides with the lower boundary of the descending triangle at 1.2510. Furthermore, the 14-day Relative Strength Index (RSI) is below the 50 level, indicating a bearish sentiment.

Additionally, the Moving Average Convergence Divergence (MACD) confirms this bearish trend, with the MACD line below the centerline and the signal line. Looking ahead, GBP/USD could encounter significant support around the psychological level of 1.2400. If this level is breached, the pair may test the five-month low of 1.2300. Read more...

GBP/USD posts modest gains above 1.2450, BoE policymaker dampens hopes of summer rates cut

The GBP/USD pair recovers to 1.2450 on Wednesday during the early Asian session. The downbeat US April PMI data and increasing appetite for the risk-linked space exert some selling pressure on the US Dollar (USD). Later in the day, the US Durable Goods Orders and weekly Mortgage Applications will be released. 

Business activity in the United States slowed in April to a four-month low owing to lower demand, according to the S&P Global report on Tuesday. The flash Manufacturing PMI came in weaker than the expectation, dropping to 49.9 in April from 51.9 in the previous reading. Meanwhile, the Services PMI declined to 50.9 from 51.7, below the market consensus of 52.0. Finally, the Composite PMI, which tracks both the manufacturing and services sectors, fell to 50.9 in April from 52.1 in March. The Greenback has attracted some sellers in response to the US economic data. Read more...

GBP/USD

Overview
Today last price1.2454
Today Daily Change0.0005
Today Daily Change %0.04
Today daily open1.2449
 
Trends
Daily SMA201.2538
Daily SMA501.2629
Daily SMA1001.2652
Daily SMA2001.2563
 
Levels
Previous Daily High1.2459
Previous Daily Low1.2332
Previous Weekly High1.2499
Previous Weekly Low1.2367
Previous Monthly High1.2894
Previous Monthly Low1.2575
Daily Fibonacci 38.2%1.241
Daily Fibonacci 61.8%1.238
Daily Pivot Point S11.2368
Daily Pivot Point S21.2287
Daily Pivot Point S31.2241
Daily Pivot Point R11.2495
Daily Pivot Point R21.254
Daily Pivot Point R31.2621

Author

More from FXStreet Team
Share:

Editor's Picks

EUR/USD accelerates losses, focus is on 1.1800

EUR/USD’s selling pressure is gathering pace now, opening the door to a potential test of the key 1.1800 region sooner rather than later. The pair’s pullback comes on the back of marked gains in the US Dollar following US data releases and the publication of the FOMC Minutes later in the day.

GBP/USD turns negative near 1.3540

GBP/USD reverses its initial upside momentum and is now adding to previous declines, revisiting at the same time the 1.3540 region on Wednesday. Cable’s downtick comes on the back of decent gains in the Greenback and easing UK inflation figures, which seem to have reinforced the case for a BoE rate cut in March.

Gold battle to regain $5,000 continues

Gold is back on the front foot on Wednesday, shaking off part of the early week softness and challenging two-day highs just above the key $5,000 mark per troy ounce. The move comes ahead of the FOMC Minutes and is unfolding despite an intense rebound in the US Dollar.

Fed Minutes to shed light on January hold decision amid hawkish rate outlook

The Minutes of the Fed’s January 27-28 monetary policy meeting will be published today. Details of discussions on the decision to leave the policy rate unchanged will be scrutinized by investors.

Mixed UK inflation data no gamechanger for the Bank of England

Food inflation plunged in January, but service sector price pressure is proving stickier. We continue to expect Bank of England rate cuts in March and June. The latest UK inflation read is a mixed bag for the Bank of England, but we doubt it drastically changes the odds of a March rate cut.

Sui extends sideways action ahead of Grayscale’s GSUI ETF launch

Sui is extending its downtrend for the second consecutive day, trading at 0.95 at the time of writing on Wednesday. The Layer-1 token is down over 16% in February and approximately 34% from the start of the year, aligning with the overall bearish sentiment across the crypto market.