GBP/USD Price Analysis: Rises to near 1.2450 despite the bearish sentiment


  • GBP/USD tests the major level of 1.2450 despite the bearish sentiment shown by the technical analysis.
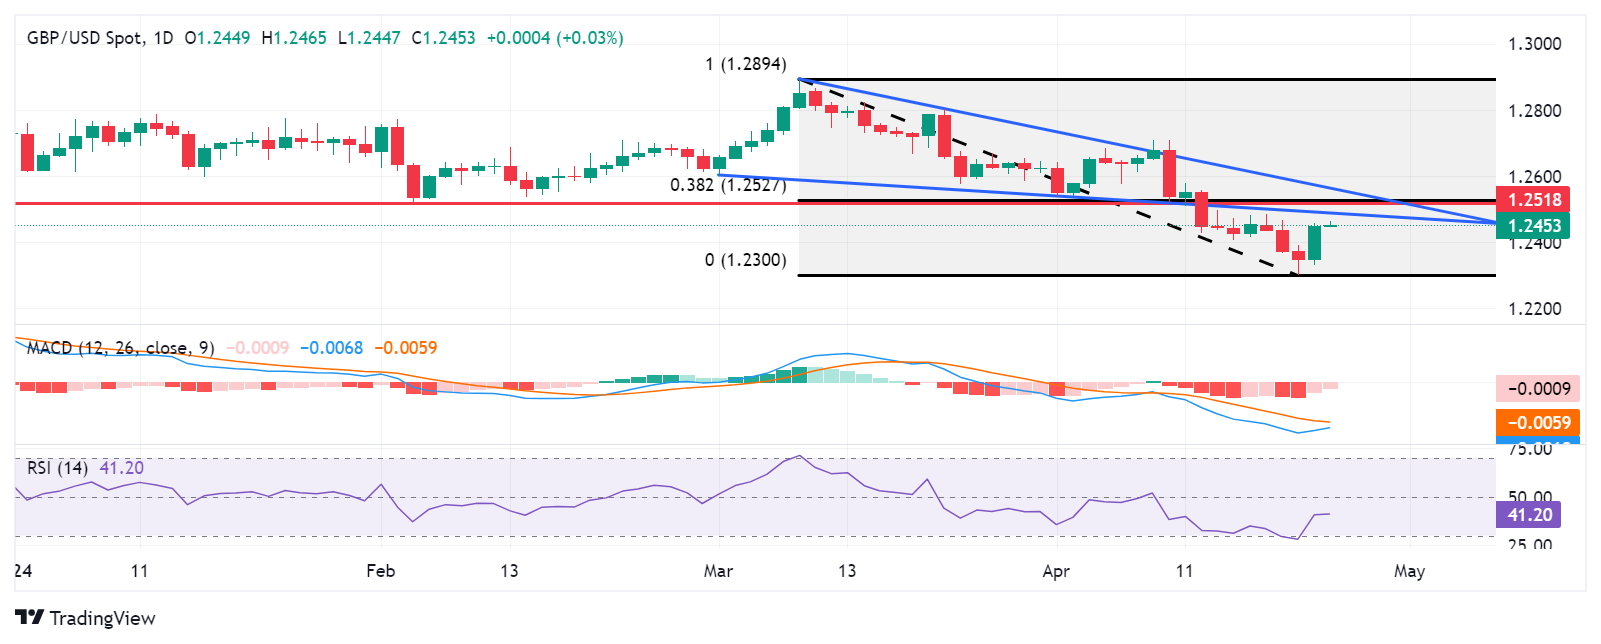
  • The pair continues to trade below the pullback resistance level at 1.2518, positioned near the lower boundary of the descending triangle.
  • The breach into the descending channel around the level of 1.2490 may lead to a weakening of the bearish sentiment.

GBP/USD has been on the rise for the second consecutive day, trading around 1.2450 in Asian trading on Wednesday. However, the pair is still below the pullback resistance at 1.2518, which coincides with the lower boundary of the descending triangle at 1.2510. Furthermore, the 14-day Relative Strength Index (RSI) is below the 50 level, indicating a bearish sentiment.

Additionally, the Moving Average Convergence Divergence (MACD) confirms this bearish trend, with the MACD line below the centerline and the signal line. Looking ahead, GBP/USD could encounter significant support around the psychological level of 1.2400. If this level is breached, the pair may test the five-month low of 1.2300.

On the upside, breaching the descending triangle around the level of 1.2490, along with surpassing the psychological level of 1.2500, could potentially weaken the bearish sentiment. Further resistance is anticipated around the pullback resistance level at 1.2518 and the 38.2% Fibonacci retracement level at 1.2527, drawn between 1.2894 and 1.2300.

A breakthrough above the latter resistance region might signify a shift towards a bullish sentiment. In such a scenario, GBP/USD could aim to test the upper boundary of the descending triangle around 1.2565.

GBP/USD: Daily Chart

GBP/USD

Overview
Today last price 1.2455
Today Daily Change 0.0006
Today Daily Change % 0.05
Today daily open 1.2449
 
Trends
Daily SMA20 1.2538
Daily SMA50 1.2629
Daily SMA100 1.2652
Daily SMA200 1.2563
 
Levels
Previous Daily High 1.2459
Previous Daily Low 1.2332
Previous Weekly High 1.2499
Previous Weekly Low 1.2367
Previous Monthly High 1.2894
Previous Monthly Low 1.2575
Daily Fibonacci 38.2% 1.241
Daily Fibonacci 61.8% 1.238
Daily Pivot Point S1 1.2368
Daily Pivot Point S2 1.2287
Daily Pivot Point S3 1.2241
Daily Pivot Point R1 1.2495
Daily Pivot Point R2 1.254
Daily Pivot Point R3 1.2621


Share: Feed news

Information on these pages contains forward-looking statements that involve risks and uncertainties. Markets and instruments profiled on this page are for informational purposes only and should not in any way come across as a recommendation to buy or sell in these assets. You should do your own thorough research before making any investment decisions. FXStreet does not in any way guarantee that this information is free from mistakes, errors, or material misstatements. It also does not guarantee that this information is of a timely nature. Investing in Open Markets involves a great deal of risk, including the loss of all or a portion of your investment, as well as emotional distress. All risks, losses and costs associated with investing, including total loss of principal, are your responsibility. The views and opinions expressed in this article are those of the authors and do not necessarily reflect the official policy or position of FXStreet nor its advertisers. The author will not be held responsible for information that is found at the end of links posted on this page.

If not otherwise explicitly mentioned in the body of the article, at the time of writing, the author has no position in any stock mentioned in this article and no business relationship with any company mentioned. The author has not received compensation for writing this article, other than from FXStreet.

FXStreet and the author do not provide personalized recommendations. The author makes no representations as to the accuracy, completeness, or suitability of this information. FXStreet and the author will not be liable for any errors, omissions or any losses, injuries or damages arising from this information and its display or use. Errors and omissions excepted.

The author and FXStreet are not registered investment advisors and nothing in this article is intended to be investment advice.

Recommended content


Recommended content

Editors’ Picks

AUD/USD extends its upside above 0.6600, eyes on RBA rate decision

AUD/USD extends its upside above 0.6600, eyes on RBA rate decision

The AUD/USD pair extends its upside around 0.6610 during the Asian session on Monday. The downbeat US employment data for April has exerted some selling pressure on the US Dollar across the board. Investors will closely monitor the Reserve Bank of Australia interest rate decision on Tuesday.

AUD/USD News

EUR/USD: Optimism prevailed, hurting US Dollar demand

EUR/USD: Optimism prevailed, hurting US Dollar demand

The EUR/USD pair advanced for a third consecutive week, accumulating a measly 160 pips in that period. The pair trades around 1.0760 ahead of the close after tumultuous headlines failed to trigger a clear directional path.

EUR/USD News

Gold holds below $2,300, Fedspeak eyed

Gold holds below $2,300, Fedspeak eyed

Gold price loses its recovery momentum around $2,295 on Monday during the early Asian session. Investors will keep an eye on Fedspeaks this week, along with the first reading of the US Michigan Consumer Sentiment Index for May on Friday.

Gold News

Bitcoin Cash could become a Cardano partnerchain as 66% of 11.3K voters say “Aye”

Bitcoin Cash could become a Cardano partnerchain as 66% of 11.3K voters say “Aye”

Bitcoin Cash is the current mania in the Cardano ecosystem following a proposal by the network’s executive inviting the public to vote on X, about a possible integration.

Read more

Week ahead: BoE and RBA decisions headline a calm week

Week ahead: BoE and RBA decisions headline a calm week

Bank of England meets on Thursday, unlikely to signal rate cuts. Reserve Bank of Australia could maintain a higher-for-longer stance. Elsewhere, Bank of Japan releases summary of opinions.

Read more

Forex MAJORS

Cryptocurrencies

Signatures