|

Palladium Price Analysis: XPD/USD eases on the way to $2,180

  • Palladium seesaws around monthly peak, keeps key trend line breakout.
  • Firmer Momentum line strengthens bullish bias, $2,460-75 becomes the key hurdle.

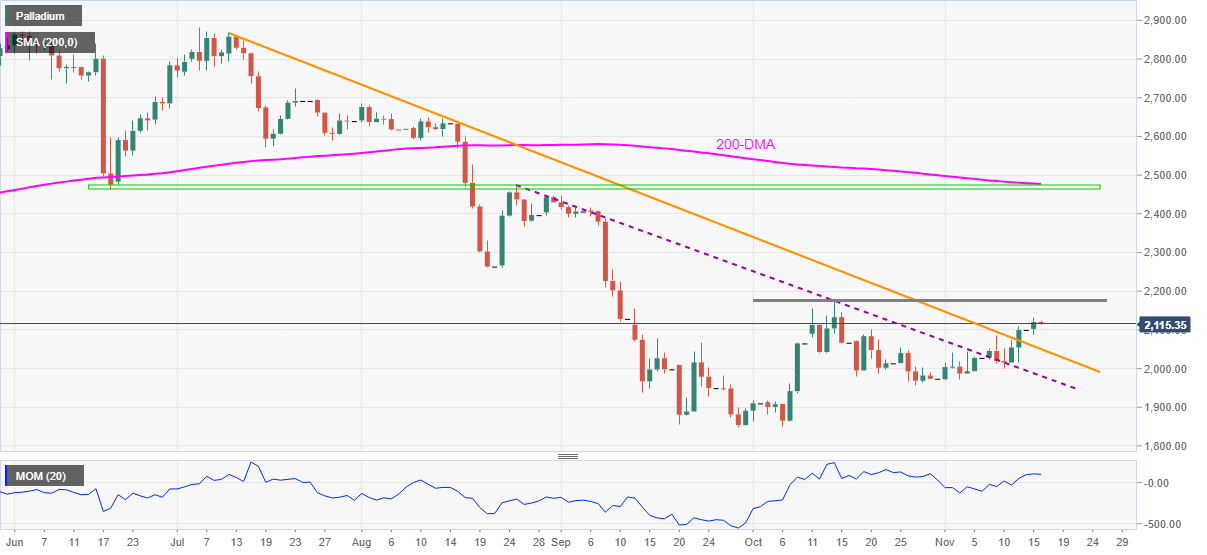
Palladium (XPD/USD) bulls take a breather around a one-month high, recently sidelined near $2,115 ahead of Tuesday’s European session.

The precious metal refreshed the multi-day top following its sustained run-up beyond the previous resistance lines from August and July. Also backing the XPD/USD bulls is the upbeat Momentum line.

Hence, the commodity buyers can ignore the latest sideways grind while aiming for October’s peak surrounding $2,180.

Though, any further upside will enable the palladium bulls to aim for the late August month’s low near $2,265. Even so, a convergence of the 200-DMA, June’s low and August 25 high, around $2460-75 becomes a tough nut to crack for them afterward.

Meanwhile, pullback moves remain less important until staying beyond a descending trend line from August, near $2,050.

Following that, the $2,000 threshold and a four-month-old support line, previous resistance, will lure the palladium bears to $1,980.

Palladium: Daily chart

Trend: Further upside expected

Additional important levels

Overview
Today last price2116.45
Today Daily Change-4.05
Today Daily Change %-0.19%
Today daily open2120.5
 
Trends
Daily SMA202022.13
Daily SMA501998.22
Daily SMA1002221.08
Daily SMA2002477.98
 
Levels
Previous Daily High2131.91
Previous Daily Low2087.29
Previous Weekly High2108.59
Previous Weekly Low2000.52
Previous Monthly High2178.1
Previous Monthly Low1849.2
Daily Fibonacci 38.2%2114.87
Daily Fibonacci 61.8%2104.33
Daily Pivot Point S12094.56
Daily Pivot Point S22068.61
Daily Pivot Point S32049.94
Daily Pivot Point R12139.18
Daily Pivot Point R22157.85
Daily Pivot Point R32183.8

Author

Anil Panchal

Anil Panchal

FXStreet

Anil Panchal has nearly 15 years of experience in tracking financial markets. With a keen interest in macroeconomics, Anil aptly tracks global news/updates and stays well-informed about the global financial moves and their implications.

More from Anil Panchal
Share:

Editor's Picks

AUD/USD stays bid above 0.7100 on Australian trade data, Mideast optimism

AUD/USD clings to minor recovery gains above 0.7100 in the Asian session on Thursday as a new Israel-Lebanon ceasefire keeps a lid on the safe-haven US Dollar. Meanwhile, strong AustralianTrade Balane data also help the Aussie pair sustain the bounce from weekly lows.

USD/JPY hovers near the 160.00 intervention threshold on Mideast tensions

USD/JPY struggles to find acceptance above 160.00 and retreats from a one-month high in the Asian session on Thursday amid fears that authorities will step in again to prop up the Japanese Yen. Furthermore, a new Israel-Lebanon ceasefire caps the US Dollar and supports the currency pair. However, renewed US-Iran tensions keep the downside limited in the Greenback and the pair.

Gold defends 200-day SMA; upside seems capped on Iran uncertainty

Gold recovers from a one-week low near $4,425, or the 200-day SMA, in the Asian session on Thursday, as news of an Israel-Lebanon ceasefire acts as a headwind for the safe-haven US Dollar. However, renewed hostilities in the Gulf, along with stalled US-Iran peace talks, keep geopolitical risks in play and should support the USD, checking the Gold price rebound.


Ethereum: Long-term holders' capitulation drives ETH below $1,800

Ethereum has fallen below $1,800 on Wednesday, the first time since May 2025 following accelerated spot selling pressure and distributions from long-term holders. The Age Consumed metric, which tracks the movement of previously idle tokens or long-term holders' coins, spiked over the past two days as prices declined, indicating increased selling activity among this cohort.

Kevin Warsh takes the Fed helm: What it means for the US Dollar
The Federal Reserve moves away from the highly predictable "forward guidance" model of the Jerome Powell era to a new “Kevin Warsh environment”, characterized by less communication, more policy surprises, and an increased focus on the Fed's complex balance sheet.
Recession on paper: What really moves the Canadian Loonie now?

Statistics Canada handed the headline writers a gift and the analysts a headache. Real GDP shrank 0.1% on an annualized basis in the first quarter, and with the fourth quarter of 2025 revised down to a 1.0% contraction, that is two negative quarters in a row, the textbook definition of a technical recession and Canada's first since the pandemic.