Oil flat with markets digesting OPEC report
- WTI Oil pares back earlier gains on downbeat OPEC report.
- Oil traders are still positioned for more upside to come in the near term.
- The US Dollar Index trades just above 103.00 after US CPI release.

Oil prices are turning flat after a volatile ride on the release of the monthly OPEC report. Biggest catalyst in the report that pushes Crude prices in the red this Tuesday comes from Iraq. The country produced substantially more barrels than the agreed quota amongst OPEC countries, and that for a second month in a row.
The US Dollar meanwhile is further advancing on its road to recovery back to being above 104.00. The second day of recovery and gains comes on the back of US Consumer Price Index (CPI) numbers which fell in line of expectations. Markets were already hoping for a rather bigger disinflationary result, though that does not look to be unfolding. Chances for the initial rate cut from the US Federal Reserve are again repriced with now biggest chances for June or July.
Crude Oil (WTI) trades at $78.01 per barrel, and Brent Oil trades at $82.28 per barrel at the time of writing.
Oil news and market movers: dust settles on OPEC report
- Exxon had to halt its 188,000 barrels per day production at its facility in Gravenchon, France. The refinery had a fire on Monday, which forced the site to stop all its activities.
- Iraq breached its output quota by producing over 200,000 barrels per day more than agreed in the OPEC agreement.
- OPEC will release on Tuesday its monthly Oil Outlook report. No timing is available on when the report will be released.
- At 20:30 GMT, the US American Petroleum Institute (API) will release its weekly Crude Oil stock datafor the week of March 8. Previous number was a small build of 423,000 barrels.
- Russian Crude shipments are rebounding to the highest level in over a year, with the bulk of the orders going to Asia.
Oil Technical Analysis: Iraq undercuts OPEC credibility
Oil prices might be facing a bit of headwind from the OPEC report, though nothing really new is on the takeaway. Crude already made its way back up above the 200-day Simple Moving Average (SMA) at $77.98 and breached the key level of $78 briefly. Should the OPEC report bear an upbeat surprise on the consumption of Oil or the adherence to the current supply cuts, Crude could rally towards $80 quite easily.
Oil bulls still clearly see more upside potential seeing the spreads on Oil futures in favour of bullish bets. The break above $80 though does not seem to be taking place that easily, and $86 is appearing as the next cap. Further up, $86.90 follows suit before targeting $89.64 and $93.98 as top levels.
On the downside, the 100-day and the 55-day Simple Moving Averages (SMA) are near $75.71 and $75.31, respectively. Add the pivotal level near $75.27, and it looks like the downside is very limited and well-equipped to resist the selling pressure.
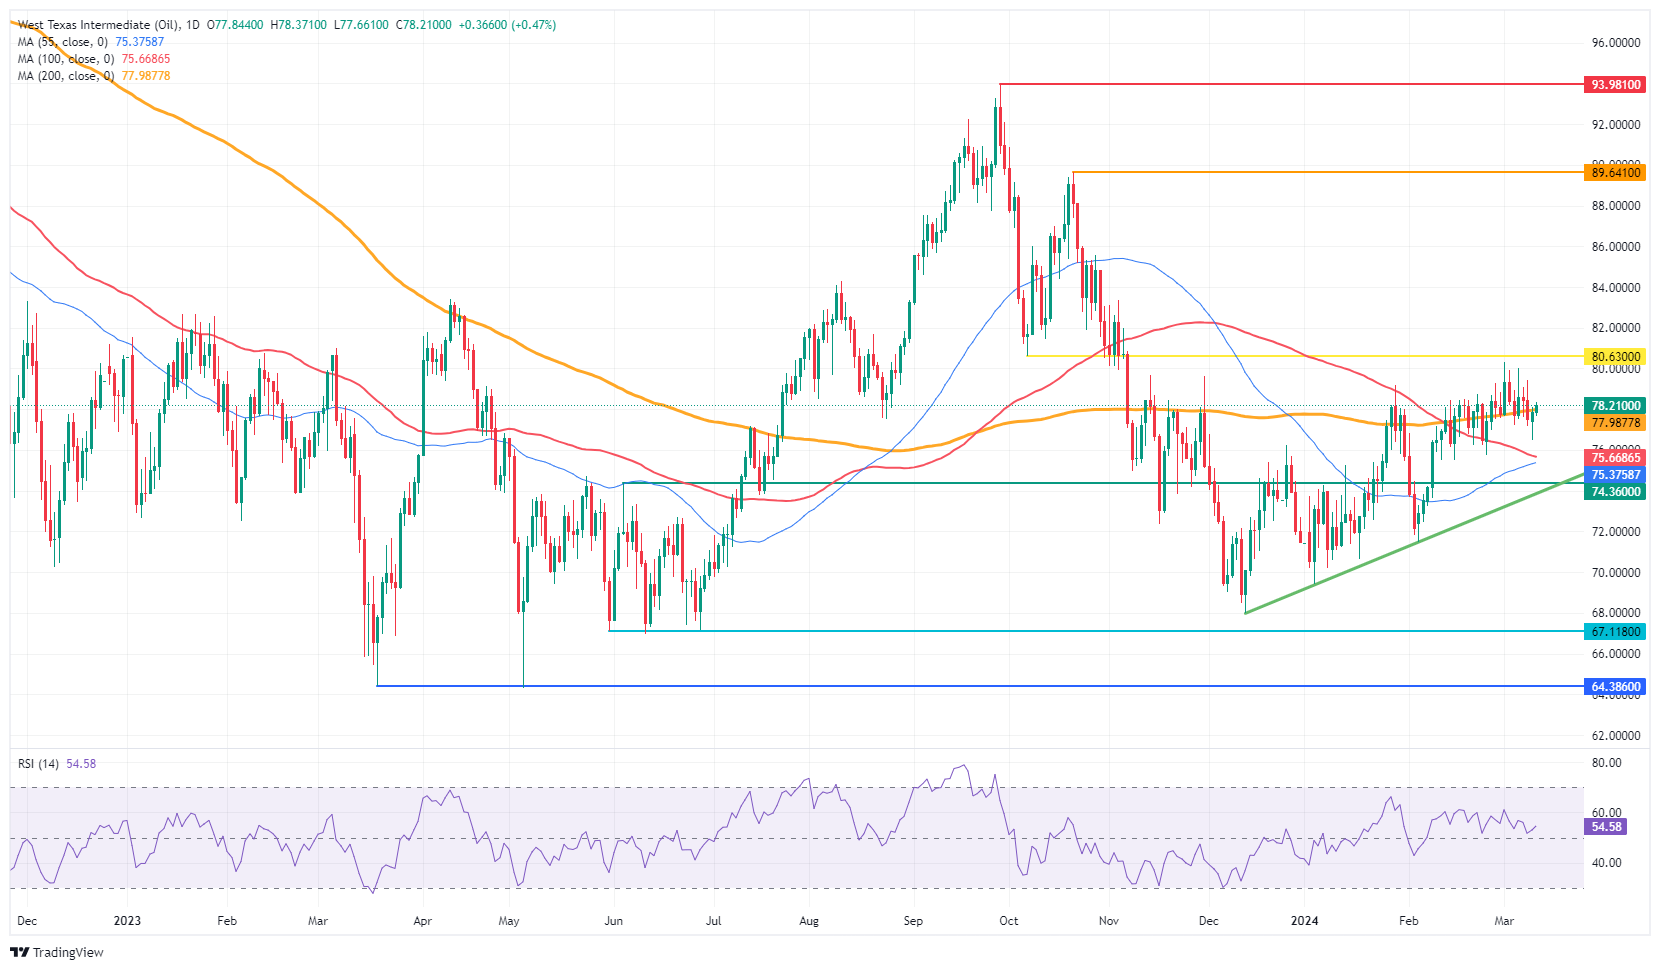
US WTI Crude Oil: Daily Chart
WTI Oil FAQs
WTI Oil is a type of Crude Oil sold on international markets. The WTI stands for West Texas Intermediate, one of three major types including Brent and Dubai Crude. WTI is also referred to as “light” and “sweet” because of its relatively low gravity and sulfur content respectively. It is considered a high quality Oil that is easily refined. It is sourced in the United States and distributed via the Cushing hub, which is considered “The Pipeline Crossroads of the World”. It is a benchmark for the Oil market and WTI price is frequently quoted in the media.
Like all assets, supply and demand are the key drivers of WTI Oil price. As such, global growth can be a driver of increased demand and vice versa for weak global growth. Political instability, wars, and sanctions can disrupt supply and impact prices. The decisions of OPEC, a group of major Oil-producing countries, is another key driver of price. The value of the US Dollar influences the price of WTI Crude Oil, since Oil is predominantly traded in US Dollars, thus a weaker US Dollar can make Oil more affordable and vice versa.
The weekly Oil inventory reports published by the American Petroleum Institute (API) and the Energy Information Agency (EIA) impact the price of WTI Oil. Changes in inventories reflect fluctuating supply and demand. If the data shows a drop in inventories it can indicate increased demand, pushing up Oil price. Higher inventories can reflect increased supply, pushing down prices. API’s report is published every Tuesday and EIA’s the day after. Their results are usually similar, falling within 1% of each other 75% of the time. The EIA data is considered more reliable, since it is a government agency.
OPEC (Organization of the Petroleum Exporting Countries) is a group of 13 Oil-producing nations who collectively decide production quotas for member countries at twice-yearly meetings. Their decisions often impact WTI Oil prices. When OPEC decides to lower quotas, it can tighten supply, pushing up Oil prices. When OPEC increases production, it has the opposite effect. OPEC+ refers to an expanded group that includes ten extra non-OPEC members, the most notable of which is Russia.
Author

Filip Lagaart
FXStreet
Filip Lagaart is a former sales/trader with over 15 years of financial markets expertise under its belt.

















