Oil unable to hold gains with Hamas signaling it is open for a ceasefire deal
- Oil took it on the chin with a 5.5% in just three trading days.
- WTI Oil's recovery to $80 gets cut short by positive news from Hamas.
- The US Dollar Index holds ground above 105.50 and trades flat ahead of weekly Jobless Claims.

Oil prices are giving up their gains for this Thursday and are at risk of making it a four-day-losing-streak after gains turned into a small loss the back of headlines that Hamas is positive on the current ceasefire deal that is on the table. More diplomatic efforts are being pushed forward in Gaza to broker a ceasefire deal, which would ease tensions in the region. Next to that, the US Energy Information Administration (EIA) reported on Wednesday one of the biggest Crude stockpile build ups seen in a long time.
The US Dollar Index (DXY) sees pressure building on an intermediate level at 105.50, after several attempts over the past two weeks to break below it. The level still holds though, ahead of the US Jobs report for May, to be released on Friday. The overnight Federal Reserve rate decision did not hold any big changes and Fed Chairman Jerome Powell confirmed that the Fed wants to see inflation first coming down further before considering a cut.
Crude Oil (WTI) trades at $78.78 and Brent Crude at $83.53 at the time of writing.
Oil news and market movers: Pressure ahead for OPEC+
- A Hamas spokesperson said that Hamas is considering the current ceasefire deal with a 'positive spirit', Bloomberg reported.
- The United Arab Emirates (UAE) main oil company has jacked up its production capacity from 4.65 million barrels per day to 4.85 million. The plan is even to reach 5 million barrels a day by 2027, just ahead of the OPEC+ meeting on prolonging the production cuts, Bloomberg reports.
- The US EIA reported on Wednesday an increase in Oil stocks of 7.265 million barrels. This surprise and large buildup was against market expectations of a 2.3 million decline and followed a 6.37 million decrease a week ago.
- India is filling up its gap of Venezuelan oil with Iraqi Ooil after US sanctions forbid India from importing, Bloomberg reports.
- Citi’s commodity analyst Eric Lee said on Wednesday in a note that OPEC+ is expected to maintain its supply curbs for the second half of this year.
- Shell’s CFO, Sinead Gorman said on a conference call that the second half of this year will be tight in terms of supply, with OPEC+ policy being key.
Oil Technical Analysis: Another risk premium taken out
Oil prices might be cooling down a touch, but the overall long-term uptrend is still very much in play, with the green ascending trend line from December last year still valid. The recent decline could be a welcomed entry level for traders that missed the boat earlier and did not want to head in above $80. Depending on a ceasefire deal and more stockpile buildup, some additional pressure could come for Oil before soaring back to $84.
After its attempt to edge higher, the recent decline makes $83.34 and the $90 handle again the first key levels on the upside. One small barrier in the way is $89.64, the peak from October 20. In case of further escalating tensions, expect even September’s peak at $94 to become a possibility.
On the downside, the 100-day Simple Moving Average (SMA) near $77.88 is the first line of defence before the actual uptrend ascending trend line gets tested. Expect that to be around $77.00 for this week. A break of that trend line could result in a drop to $74.36.
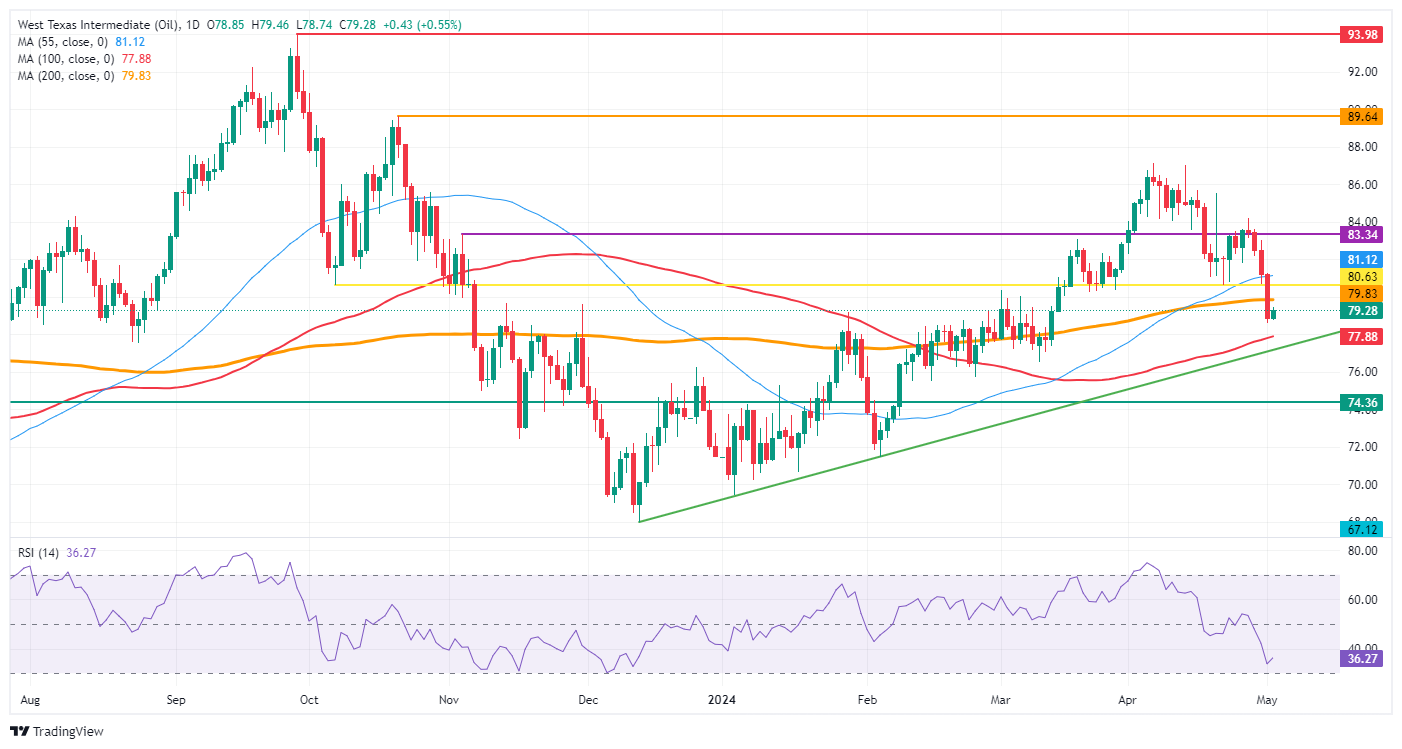
US WTI Crude Oil: Daily Chart
WTI Oil FAQs
WTI Oil is a type of Crude Oil sold on international markets. The WTI stands for West Texas Intermediate, one of three major types including Brent and Dubai Crude. WTI is also referred to as “light” and “sweet” because of its relatively low gravity and sulfur content respectively. It is considered a high quality Oil that is easily refined. It is sourced in the United States and distributed via the Cushing hub, which is considered “The Pipeline Crossroads of the World”. It is a benchmark for the Oil market and WTI price is frequently quoted in the media.
Like all assets, supply and demand are the key drivers of WTI Oil price. As such, global growth can be a driver of increased demand and vice versa for weak global growth. Political instability, wars, and sanctions can disrupt supply and impact prices. The decisions of OPEC, a group of major Oil-producing countries, is another key driver of price. The value of the US Dollar influences the price of WTI Crude Oil, since Oil is predominantly traded in US Dollars, thus a weaker US Dollar can make Oil more affordable and vice versa.
The weekly Oil inventory reports published by the American Petroleum Institute (API) and the Energy Information Agency (EIA) impact the price of WTI Oil. Changes in inventories reflect fluctuating supply and demand. If the data shows a drop in inventories it can indicate increased demand, pushing up Oil price. Higher inventories can reflect increased supply, pushing down prices. API’s report is published every Tuesday and EIA’s the day after. Their results are usually similar, falling within 1% of each other 75% of the time. The EIA data is considered more reliable, since it is a government agency.
OPEC (Organization of the Petroleum Exporting Countries) is a group of 13 Oil-producing nations who collectively decide production quotas for member countries at twice-yearly meetings. Their decisions often impact WTI Oil prices. When OPEC decides to lower quotas, it can tighten supply, pushing up Oil prices. When OPEC increases production, it has the opposite effect. OPEC+ refers to an expanded group that includes ten extra non-OPEC members, the most notable of which is Russia.
Author

Filip Lagaart
FXStreet
Filip Lagaart is a former sales/trader with over 15 years of financial markets expertise under its belt.


