|

NZD/USD technical analysis: 0.6342/36 becomes a tough nut to crack for sellers

  • NZD/USD nears key support confluence following its U-turn from 38.2% Fibonacci retracement.
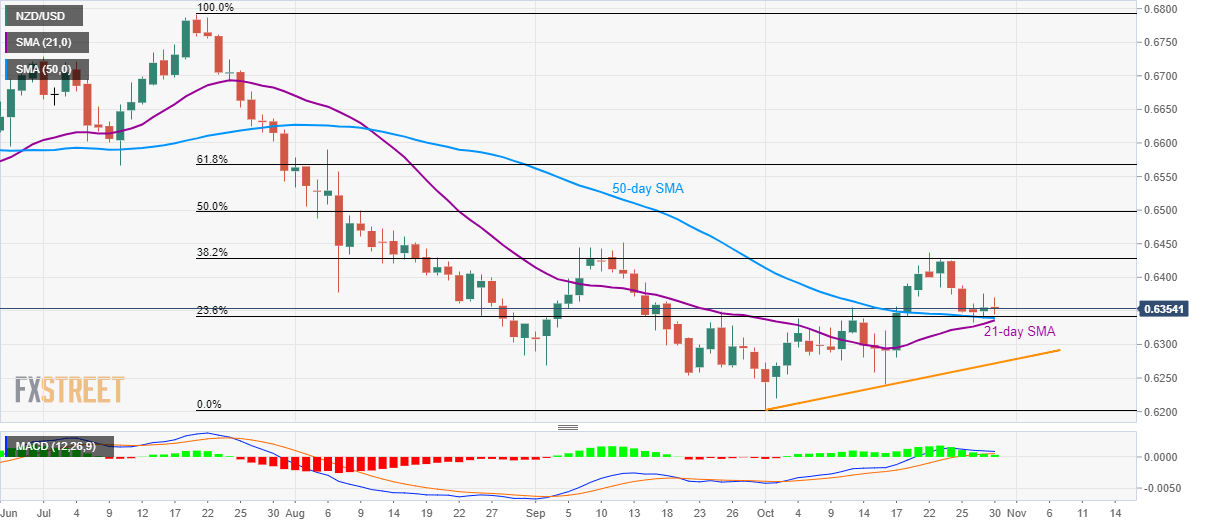
  • 21/50-day SMA and 23.6% Fibonacci retracement limit the pair’s downside towards monthly rising trend line.

Despite witnessing a pullback during the last one week, NZD/USD refrains from breaking the key support confluence while taking rounds to 0.6355 during early Wednesday.

Prices stay above 21-day and 50-day Simple Moving Averages (SMA), as well as 23.6% Fibonacci retracement of July-October downpour, around 0.6342/36, which in turn portrays the pair’s underlying strength.

However, 38.2% Fibonacci retracement level near 0.6430, followed by September month high close to 0.6455, seems to limit the pair’s immediate upside.

In a case where buyers sneak in around 0.6455, 50% Fibonacci retracement close to 0.6500 will become their favorites.

Alternatively, pair’s sustained break below 0.6336 will set the tone for the next round of declines targeting monthly rising support line, at 0.6270, and monthly bottom close to 0.6200.

NZD/USD daily chart

Trend: pullback expected

additional important levels

Overview
Today last price0.6356
Today Daily Change1 pip
Today Daily Change %0.02%
Today daily open0.6355
 
Trends
Daily SMA200.6335
Daily SMA500.634
Daily SMA1000.6469
Daily SMA2000.6599
 
Levels
Previous Daily High0.6376
Previous Daily Low0.6338
Previous Weekly High0.6437
Previous Weekly Low0.6347
Previous Monthly High0.6452
Previous Monthly Low0.6249
Daily Fibonacci 38.2%0.6361
Daily Fibonacci 61.8%0.6353
Daily Pivot Point S10.6337
Daily Pivot Point S20.6318
Daily Pivot Point S30.6299
Daily Pivot Point R10.6375
Daily Pivot Point R20.6394
Daily Pivot Point R30.6413

Author

Anil Panchal

Anil Panchal

FXStreet

Anil Panchal has nearly 15 years of experience in tracking financial markets. With a keen interest in macroeconomics, Anil aptly tracks global news/updates and stays well-informed about the global financial moves and their implications.

More from Anil Panchal
Share:

Editor's Picks

EUR/USD looks apathetic around 1.1770

EUR/USD comes under renewed pressure on Tuesday, deflating below the 1.1800 support and reversing two consecutive days of gains. The pair’s decline follows the persistent move higher in the US Dollar, as trade uncertainty dominates the sentiment ahead of President Trump’s SOTU speech.

GBP/USD regains 1.3500 and above

GBP/USD extends its advance for the third day in a row on Tuesday, this time retesting the area beyond the 1.3500 hurdle. Cable’s uptick comes despite decent gains in the Greenback and the dovish message from the BoE’s Bailey at the UK Parliament.

Gold appears offered around $5,150

Gold is giving back a good portion of the recent multi-day rally, receding to the $5,150 zone per troy ounce amid the decent bounce in the US Dollar and mixed US Treasuty yields. In the meantime, markets’ attention remain on upcoming comments from Fed speakers.

Crypto Today: Bitcoin, Ethereum, XRP come under renewed pressure amid ETF outflows, tariff uncertainty

Bitcoin, Ethereum and Ripple are trading under increasing selling pressure at the time of writing on Tuesday, as market participants navigate renewed tariff uncertainty. The Crypto King holds above $63,000, down 2% intraday from its $64,656 open.

The Citrini report: How a debatable AI narrative can shake Wall Street

That AI-related headline alone was enough to rattle investors.US stocks slid sharply on Monday after a widely circulated Citrini Research memo outlined a hypothetical “2028 Global Intelligence Crisis”, warning that rapid AI adoption could push US unemployment into double digits as early as by mid-2028.

XRP pressured by weak ETF flows and declining retail interest

Ripple (XRP) is edging lower, trading above its intraday low of $1.32 at the time of writing on Tuesday. The decline from its weekly opening of $1.39 reflects heightened volatility in the broader cryptocurrency market, accentuated by tariff-triggered uncertainty.