NZD/USD Price Forecast: Tests 0.5600 support near lower descending channel limit
- NZD/USD may test the key support at the lower boundary of the descending channel near 0.5570.
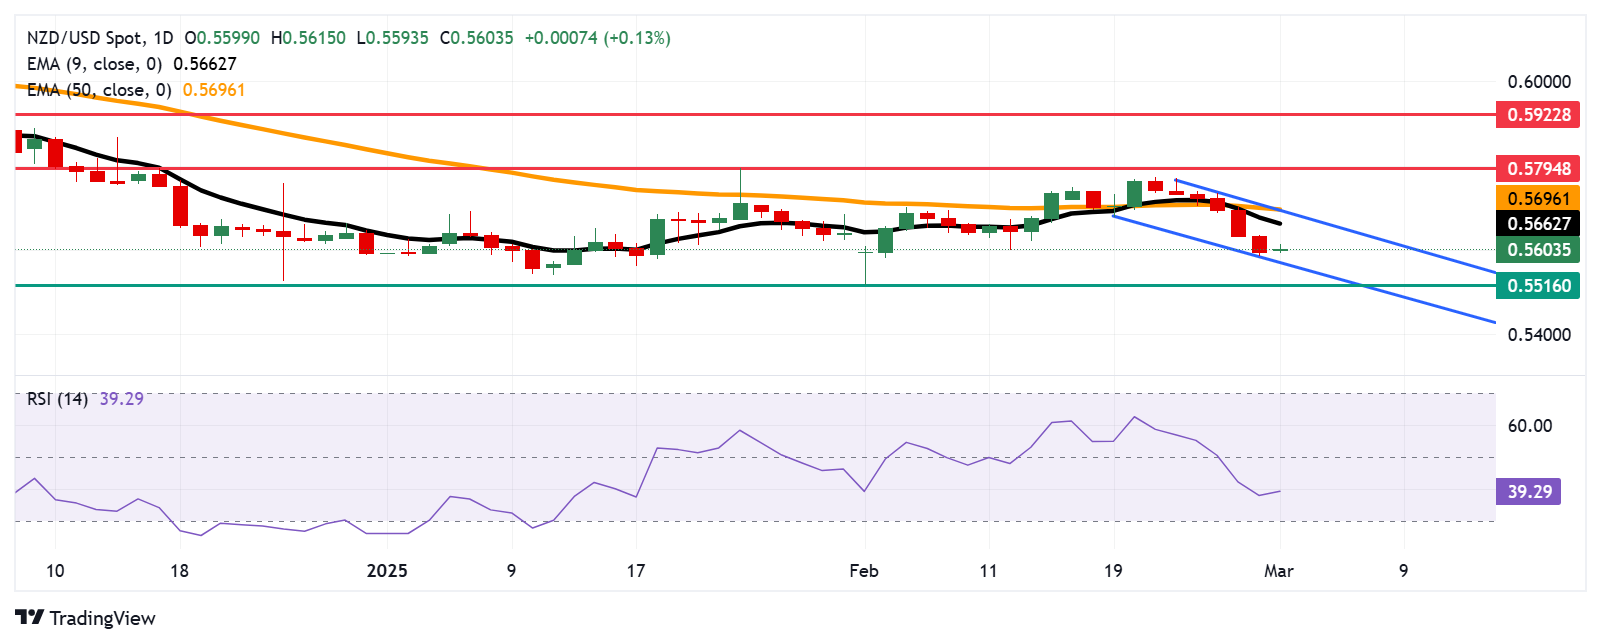
- The 14-day Relative Strength Index remains below 50, reinforcing the pair’s bearish outlook.
- The pair could target the initial resistance at the nine-day Exponential Moving Average of 0.5662.

The NZD/USD pair holds ground after registering a six-day losing streak, trading around 0.5600 during European trading hours on Monday. Technical analysis of the daily chart suggests a bearish market bias, as the pair moves downwards within a descending channel pattern.
The 14-day Relative Strength Index (RSI) remains below the 50 level, strengthening the bearish outlook for the pair. Moreover, the NZD/USD pair stays positioned below the nine- and 14-day Exponential Moving Averages (EMAs), indicating weaker short-term momentum.
On the downside, a successful break below the psychological level of 0.5600 would lead the NZD/USD pair to test the crucial support at the lower boundary of the descending channel at 0.5570 level. A break below this support zone could reinforce the bearish bias and put downward pressure on the pair to test 0.5516, its lowest level since October 2022, recorded on February 3.
The NZD/USD pair could target the primary barrier at a nine-day EMA of 0.5662, followed by the 50-day EMA at 0.5696, which is aligned with the descending channel’s upper boundary. A break above the channel would weaken the bearish sentiment and support the pair to explore the region around the three-month high at 0.5794, reached on January 24.
NZD/USD: Daily Chart
New Zealand Dollar PRICE Today
The table below shows the percentage change of New Zealand Dollar (NZD) against listed major currencies today. New Zealand Dollar was the strongest against the US Dollar.
| USD | EUR | GBP | JPY | CAD | AUD | NZD | CHF | |
|---|---|---|---|---|---|---|---|---|
| USD | -0.26% | -0.11% | -0.30% | -0.08% | -0.17% | -0.08% | -0.18% | |
| EUR | 0.26% | 0.03% | -0.25% | -0.01% | -0.01% | -0.01% | -0.11% | |
| GBP | 0.11% | -0.03% | -0.19% | -0.04% | -0.04% | -0.04% | -0.14% | |
| JPY | 0.30% | 0.25% | 0.19% | 0.44% | 0.17% | 0.26% | 0.11% | |
| CAD | 0.08% | 0.01% | 0.04% | -0.44% | 0.06% | -0.00% | -0.10% | |
| AUD | 0.17% | 0.01% | 0.04% | -0.17% | -0.06% | -0.00% | -0.08% | |
| NZD | 0.08% | 0.01% | 0.04% | -0.26% | 0.00% | 0.00% | -0.10% | |
| CHF | 0.18% | 0.11% | 0.14% | -0.11% | 0.10% | 0.08% | 0.10% |
The heat map shows percentage changes of major currencies against each other. The base currency is picked from the left column, while the quote currency is picked from the top row. For example, if you pick the New Zealand Dollar from the left column and move along the horizontal line to the US Dollar, the percentage change displayed in the box will represent NZD (base)/USD (quote).
Author

Akhtar Faruqui
FXStreet
Akhtar Faruqui is a Forex Analyst based in New Delhi, India. With a keen eye for market trends and a passion for dissecting complex financial dynamics, he is dedicated to delivering accurate and insightful Forex news and analysis.


