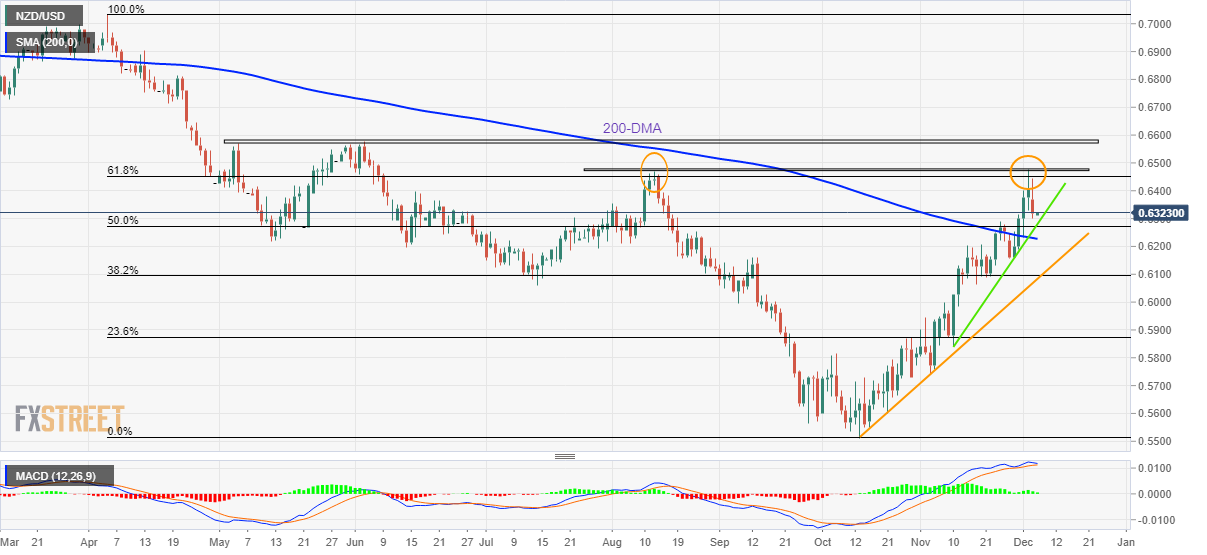
NZD/USD Price Analysis: Stays defensive above 0.6300, double tops tease bears


  • NZD/USD holds lower ground after reversing from six-month high.
  • Bearish chart formation, impending bear cross on the MACD challenge recovery moves.
  • 200-DMA, monthly support line restrict immediate downside, bulls need validation from 0.6480.

NZD/USD retreats from an intraday high of 0.6323 as it fades the corrective bounce after a two-day downtrend amid Tuesday’s Asian session.

Given the looming bearish cross on the MACD indicator, coupled with the last week’s failure to stay beyond the August month’s high near 0.6470, the Kiwi pair is likely to remain bearish.

That said, a one-month-old ascending support line near 0.6280 and the 50% Fibonacci retracement level of the pair’s April-October downside, close to 0.6275, could restrict short-term declines of the NZD/USD pair.

However, the 200-DMA and an upward-sloping trend line from October’s low, respectively near 0.6225 and 0.6080, appear tough nuts to crack for the NZD/USD bears afterward.

On the flip side, the 61.8% Fibonacci retracement level of 0.6452, also known as the golden ratio, challenges the intraday pair buyers ahead of the double tops marked near 0.6470-75.

It’s worth noting that highs marked in May and June, around 0.6570-75, act as the last defense of the NZD/USD bears.

Overall, NZD/USD remains on the bear’s radar despite the recent hesitance to break the 0.6300 threshold.

NZD/USD: Daily chart

Trend: Further downside expected

Additional important levels

Overview
Today last price 0.6317
Today Daily Change -0.0088
Today Daily Change % -1.37%
Today daily open 0.6405
 
Trends
Daily SMA20 0.6154
Daily SMA50 0.5886
Daily SMA100 0.6027
Daily SMA200 0.629
 
Levels
Previous Daily High 0.6477
Previous Daily Low 0.6327
Previous Weekly High 0.6477
Previous Weekly Low 0.6155
Previous Monthly High 0.6314
Previous Monthly Low 0.5741
Daily Fibonacci 38.2% 0.642
Daily Fibonacci 61.8% 0.6384
Daily Pivot Point S1 0.6329
Daily Pivot Point S2 0.6254
Daily Pivot Point S3 0.618
Daily Pivot Point R1 0.6479
Daily Pivot Point R2 0.6553
Daily Pivot Point R3 0.6628


Share: Feed news

Information on these pages contains forward-looking statements that involve risks and uncertainties. Markets and instruments profiled on this page are for informational purposes only and should not in any way come across as a recommendation to buy or sell in these assets. You should do your own thorough research before making any investment decisions. FXStreet does not in any way guarantee that this information is free from mistakes, errors, or material misstatements. It also does not guarantee that this information is of a timely nature. Investing in Open Markets involves a great deal of risk, including the loss of all or a portion of your investment, as well as emotional distress. All risks, losses and costs associated with investing, including total loss of principal, are your responsibility. The views and opinions expressed in this article are those of the authors and do not necessarily reflect the official policy or position of FXStreet nor its advertisers. The author will not be held responsible for information that is found at the end of links posted on this page.

If not otherwise explicitly mentioned in the body of the article, at the time of writing, the author has no position in any stock mentioned in this article and no business relationship with any company mentioned. The author has not received compensation for writing this article, other than from FXStreet.

FXStreet and the author do not provide personalized recommendations. The author makes no representations as to the accuracy, completeness, or suitability of this information. FXStreet and the author will not be liable for any errors, omissions or any losses, injuries or damages arising from this information and its display or use. Errors and omissions excepted.

The author and FXStreet are not registered investment advisors and nothing in this article is intended to be investment advice.

Recommended content


Recommended content

Editors’ Picks

EUR/USD clings to gains above 1.0750 after US data

EUR/USD clings to gains above 1.0750 after US data

EUR/USD manages to hold in positive territory above 1.0750 despite retreating from the fresh multi-week high it set above 1.0800 earlier in the day. The US Dollar struggles to find demand following the weaker-than-expected NFP data.

EUR/USD News

GBP/USD declines below 1.2550 following NFP-inspired upsurge

GBP/USD declines below 1.2550 following NFP-inspired upsurge

GBP/USD struggles to preserve its bullish momentum and trades below 1.2550 in the American session. Earlier in the day, the disappointing April jobs report from the US triggered a USD selloff and allowed the pair to reach multi-week highs above 1.2600.

GBP/USD News

Gold struggles to hold above $2,300 despite falling US yields

Gold struggles to hold above $2,300 despite falling US yields

Gold stays on the back foot below $2,300 in the American session on Friday. The benchmark 10-year US Treasury bond yield stays in negative territory below 4.6% after weak US data but the improving risk mood doesn't allow XAU/USD to gain traction.

Gold News

Bitcoin Weekly Forecast: Should you buy BTC here? Premium

Bitcoin Weekly Forecast: Should you buy BTC here?

Bitcoin (BTC) price shows signs of a potential reversal but lacks confirmation, which has divided the investor community into two – those who are buying the dips and those who are expecting a further correction.

Read more

Week ahead – BoE and RBA decisions headline a calm week

Week ahead – BoE and RBA decisions headline a calm week

Bank of England meets on Thursday, unlikely to signal rate cuts. Reserve Bank of Australia could maintain a higher-for-longer stance. Elsewhere, Bank of Japan releases summary of opinions.

Read more

Forex MAJORS

Cryptocurrencies

Signatures