NZD/USD Price Analysis: Further upside towards 0.6575 appears imminent


  • NZD/USD crosses two-week-old resistance line to highlight trader’s bullish bias.
  • Upbeat MACD, RSI adds strength to the run-up targeting fresh multi-month high.
  • Convergence of 61.8% Fibonacci Expansion, June 2022 high appears a tough nut to crack for buyers.
  • Sellers need 100-SMA breakdown to confirm further downside.

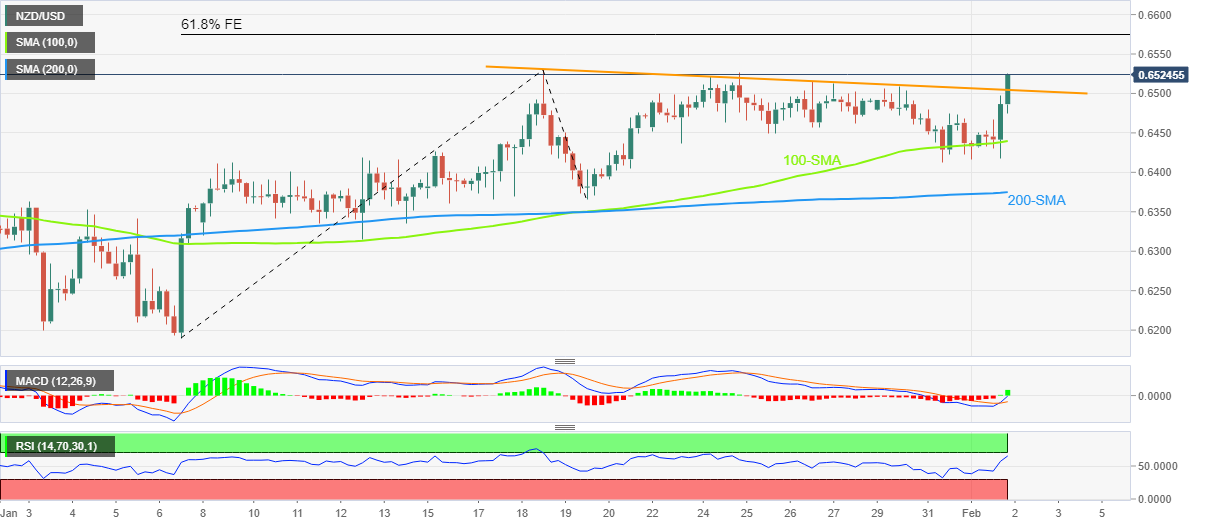
NZD/USD takes the bids to refresh the weekly high near 0.6520 during early Thursday’s Asian session. In doing so, the Kiwi pair extends its rebound from the 100-SMA to cross a downward-sloping resistance line from January 18.

Not only the successful recovery from the 100-SMA and the trend line breakout but bullish MACD signals and the upbeat RSI (14) also keep NZD/USD buyers hopeful.

As a result, the Kiwi pair is all set to poke the previous monthly high of 0.6530.

It’s worth noting, however, that a convergence of June 2022 high and 61.8% Fibonacci Expansion (FE) of its January 06-19 moves, near 0.6575, appears a strong resistance for the NZD/USD bulls to cross to keep the reins afterward.

On the flip side, pullback remains elusive unless the NZD/USD pair stays above the recent resistance-turned-support line near the 0.6500 round figure.

Even if the NZD/USD price drops below 0.6500 resistance-turned-support, the 100-SMA and the weekly low, respectively around 0.6440 and 0.6410, could challenge the pair’s further downside.

In a case where NZD/USD remains weak past 0.6410, the 200-SMA level near 0.6375 could act as the last defense of the bears.

NZD/USD: Four-hour chart

Trend: Further upside expected

Additional important levels

Overview
Today last price 0.6519
Today Daily Change 0.0054
Today Daily Change % 0.84%
Today daily open 0.6465
 
Trends
Daily SMA20 0.6413
Daily SMA50 0.6359
Daily SMA100 0.6093
Daily SMA200 0.6192
 
Levels
Previous Daily High 0.6479
Previous Daily Low 0.6412
Previous Weekly High 0.6526
Previous Weekly Low 0.6437
Previous Monthly High 0.6531
Previous Monthly Low 0.619
Daily Fibonacci 38.2% 0.6438
Daily Fibonacci 61.8% 0.6454
Daily Pivot Point S1 0.6425
Daily Pivot Point S2 0.6385
Daily Pivot Point S3 0.6358
Daily Pivot Point R1 0.6492
Daily Pivot Point R2 0.6519
Daily Pivot Point R3 0.6559


Share: Feed news

Information on these pages contains forward-looking statements that involve risks and uncertainties. Markets and instruments profiled on this page are for informational purposes only and should not in any way come across as a recommendation to buy or sell in these assets. You should do your own thorough research before making any investment decisions. FXStreet does not in any way guarantee that this information is free from mistakes, errors, or material misstatements. It also does not guarantee that this information is of a timely nature. Investing in Open Markets involves a great deal of risk, including the loss of all or a portion of your investment, as well as emotional distress. All risks, losses and costs associated with investing, including total loss of principal, are your responsibility. The views and opinions expressed in this article are those of the authors and do not necessarily reflect the official policy or position of FXStreet nor its advertisers. The author will not be held responsible for information that is found at the end of links posted on this page.

If not otherwise explicitly mentioned in the body of the article, at the time of writing, the author has no position in any stock mentioned in this article and no business relationship with any company mentioned. The author has not received compensation for writing this article, other than from FXStreet.

FXStreet and the author do not provide personalized recommendations. The author makes no representations as to the accuracy, completeness, or suitability of this information. FXStreet and the author will not be liable for any errors, omissions or any losses, injuries or damages arising from this information and its display or use. Errors and omissions excepted.

The author and FXStreet are not registered investment advisors and nothing in this article is intended to be investment advice.

Recommended content


Recommended content

Editors’ Picks

EUR/USD rises toward 1.0700 after Germany PMI data

EUR/USD rises toward 1.0700 after Germany PMI data

EUR/USD gains traction and rises toward 1.0700 in the early European session on Monday. HCOB Composite PMI in Germany improved to 50.5 in April from 47.7 in March, providing a boost to the Euro. Focus shifts Eurozone and US PMI readings.

EUR/USD News

GBP/USD eases below 1.2350, UK PMIs eyed

GBP/USD eases below 1.2350, UK PMIs eyed

GBP/USD is dropping below 1.2350 in the European session, as the US Dollar sees fresh buying interest on tepid risk sentiment. The further downside in the pair could remain capped, as traders await the UK PMI reports for fresh trading impetus. 

GBP/USD News

Gold price flirts with $2,300 amid receding safe-haven demand, reduced Fed rate cut bets

Gold price flirts with $2,300 amid receding safe-haven demand, reduced Fed rate cut bets

Gold price (XAU/USD) remains under heavy selling pressure for the second straight day on Tuesday and languishes near its lowest level in over two weeks, around the $2,300 mark heading into the European session.

Gold News

PENDLE price soars 10% after Arthur Hayes’ optimism on Pendle derivative exchange

PENDLE price soars 10% after Arthur Hayes’ optimism on Pendle derivative exchange

Pendle is among the top performers in the cryptocurrency market today, posting double-digit gains. Its peers in the altcoin space are not as forthcoming even as the market enjoys bullish sentiment inspired by Bitcoin price.

Read more

Focus on April PMIs today

Focus on April PMIs today

In the euro area, focus today will be on the euro area PMIs for April. The previous months' PMIs have shown a return of the two-speed economy with the service sector in expansionary territory and manufacturing sector stuck in contraction. 

Read more

Forex MAJORS

Cryptocurrencies

Signatures