NZD/USD Price Analysis: Further recovery hinges on 0.6230-35 breakout


  • NZD/USD recovers from three-week-old horizontal support area to snap two-day downtrend.
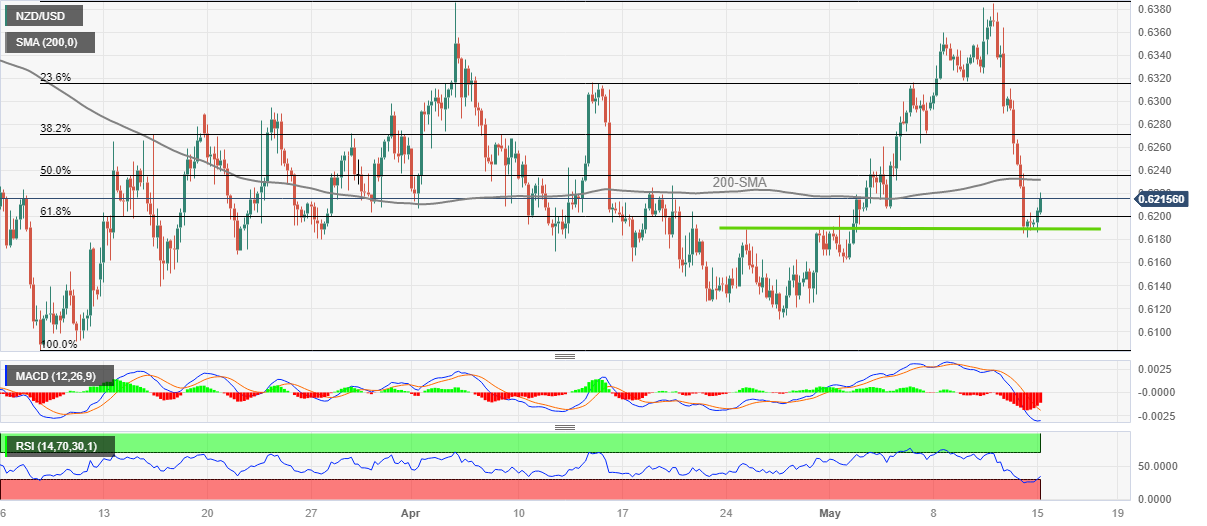
  • Oversold RSI (14) line favors corrective bounce but convergence of 200-SMA, 50% Fibonacci retracement guards immediate upside.
  • Multiple hurdles toward the north, bearish MACD signals prod Kiwi pair buyers.

NZD/USD pares the biggest weekly gain since late January as it picks up bids to refresh its intraday high near 0.6220 heading into Monday’s European session. In doing so, the Kiwi pair takes a U-turn from three-week-long horizontal support, amid an oversold RSI (14) line, to print the first daily run-up in three.

That said, the quote’s latest rebound pushes back the NZD/USD prices above the 61.8% Fibonacci retracement of its March-April upside.

However, a convergence of the 200-SMA and 50% Fibonacci retracement, near 0.6230-35, guards the NZD/USD pair’s immediate upside.

Following that, a quick run-up towards the 38.2% Fibonacci retracement level of near 0.6270 can’t be ruled out. Though, the 0.6300 and mid-April high of around 0.6315 could challenge the Kiwi pair’s further advances before directing the bulls towards the yearly top marked the last month around 0.6385.

On the other hand, a daily closing below the aforementioned horizontal support comprising levels marked since April 25, around 0.6190, could recall the NZD/USD bears targeting the monthly low of 0.6110.

Though, multiple levels marked near the 0.6100 round figure and the yearly low marked in March around 0.6085 could challenge the Kiwi pair sellers afterward.

NZD/USD: Four-hour chart

Trend: Limited upside expected

Additional important levels

Overview
Today last price 0.6216
Today Daily Change 0.0021
Today Daily Change % 0.34%
Today daily open 0.6195
 
Trends
Daily SMA20 0.6217
Daily SMA50 0.622
Daily SMA100 0.6279
Daily SMA200 0.6161
 
Levels
Previous Daily High 0.6311
Previous Daily Low 0.6182
Previous Weekly High 0.6385
Previous Weekly Low 0.6182
Previous Monthly High 0.6389
Previous Monthly Low 0.6111
Daily Fibonacci 38.2% 0.6231
Daily Fibonacci 61.8% 0.6262
Daily Pivot Point S1 0.6148
Daily Pivot Point S2 0.61
Daily Pivot Point S3 0.6018
Daily Pivot Point R1 0.6277
Daily Pivot Point R2 0.6358
Daily Pivot Point R3 0.6406


Share: Feed news

Information on these pages contains forward-looking statements that involve risks and uncertainties. Markets and instruments profiled on this page are for informational purposes only and should not in any way come across as a recommendation to buy or sell in these assets. You should do your own thorough research before making any investment decisions. FXStreet does not in any way guarantee that this information is free from mistakes, errors, or material misstatements. It also does not guarantee that this information is of a timely nature. Investing in Open Markets involves a great deal of risk, including the loss of all or a portion of your investment, as well as emotional distress. All risks, losses and costs associated with investing, including total loss of principal, are your responsibility. The views and opinions expressed in this article are those of the authors and do not necessarily reflect the official policy or position of FXStreet nor its advertisers. The author will not be held responsible for information that is found at the end of links posted on this page.

If not otherwise explicitly mentioned in the body of the article, at the time of writing, the author has no position in any stock mentioned in this article and no business relationship with any company mentioned. The author has not received compensation for writing this article, other than from FXStreet.

FXStreet and the author do not provide personalized recommendations. The author makes no representations as to the accuracy, completeness, or suitability of this information. FXStreet and the author will not be liable for any errors, omissions or any losses, injuries or damages arising from this information and its display or use. Errors and omissions excepted.

The author and FXStreet are not registered investment advisors and nothing in this article is intended to be investment advice.

Recommended content


Recommended content

Editors’ Picks

EUR/USD holds below 1.0750 ahead of key US data

EUR/USD holds below 1.0750 ahead of key US data

EUR/USD trades in a tight range below 1.0750 in the European session on Friday. The US Dollar struggles to gather strength ahead of key PCE Price Index data, the Fed's preferred gauge of inflation, and helps the pair hold its ground. 

EUR/USD News

USD/JPY stays firm above 156.00 after BoJ Governor Ueda's comments

USD/JPY stays firm above 156.00 after BoJ Governor Ueda's comments

USD/JPY stays firm above 156.00 after surging above this level on the Bank of Japan's decision to leave the policy settings unchanged. BoJ Governor said weak Yen was not impacting prices but added that they will watch FX developments closely.

USD/JPY News

Gold price oscillates in a range as the focus remains glued to the US PCE Price Index

Gold price oscillates in a range as the focus remains glued to the US PCE Price Index

Gold price struggles to attract any meaningful buyers amid the emergence of fresh USD buying. Bets that the Fed will keep rates higher for longer amid sticky inflation help revive the USD demand.

Gold News

Bitcoin Weekly Forecast: BTC’s next breakout could propel it to $80,000 Premium

Bitcoin Weekly Forecast: BTC’s next breakout could propel it to $80,000

Bitcoin’s recent price consolidation could be nearing its end as technical indicators and on-chain metrics suggest a potential upward breakout. However, this move would not be straightforward and could punish impatient investors. 

Read more

US core PCE inflation set to signal firm price pressures as markets delay Federal Reserve rate cut bets

US core PCE inflation set to signal firm price pressures as markets delay Federal Reserve rate cut bets

The core PCE Price Index, which excludes volatile food and energy prices, is seen as the more influential measure of inflation in terms of Fed positioning. The index is forecast to rise 0.3% on a monthly basis in March, matching February’s increase. 

Read more

Forex MAJORS

Cryptocurrencies

Signatures