- NZD/USD retreats towards 50-HMA, snaps two-day winning streak.
- Bearish MACD signals, weekly resistance line keep sellers hopeful
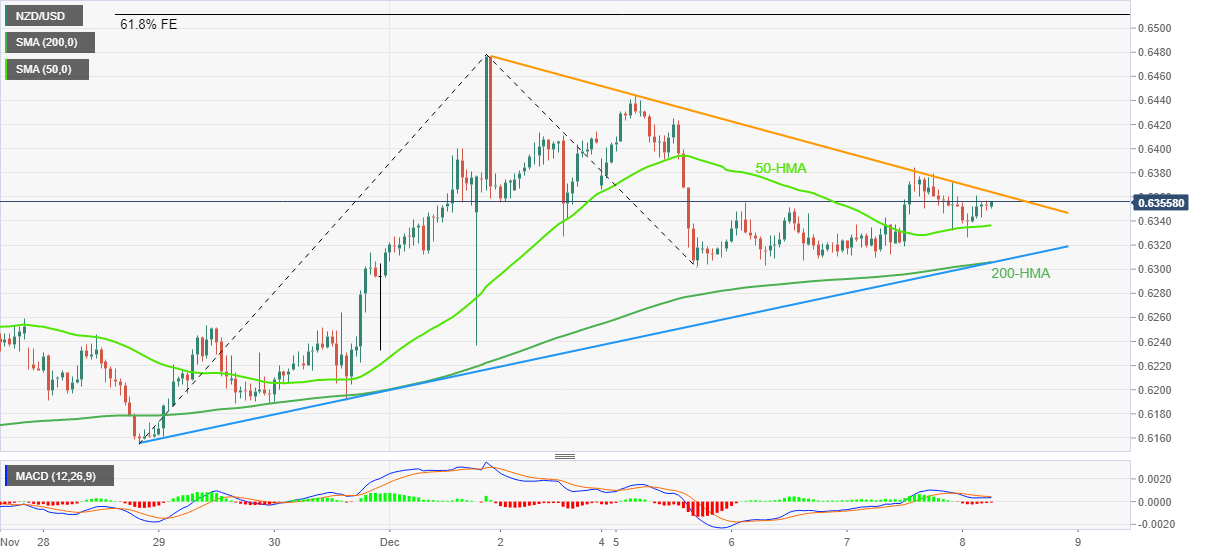
- Convergence of 200-HMA, ascending trend line from late November challenge further downside.
- Bulls need validation from 0.6470-75 to refresh yearly top.
NZD/USD remains mildly offered around 0.6350 heading into Thursday’s European session.
In doing so, the Kiwi pair struggles to extend the day-start bounce off the 50-Hour Moving Average (HMA) while defending the one-week-old bearish trend, as shown by the descending trend line. Also supporting the downside bias are the bearish MACD signals.
That said, a clear downside break of the 50-HMA, around 0.6335 by the press time, holds the key to the NZD/USD pair’s short-term downside.
Even so, the 200-HMA and an upward-sloping trend line from November 28, close to 0.6300, appears a tough nut to crack for the Kiwi pair sellers.
Following that, a slump towards the late November swing low near 0.6155 can’t be ruled out.
Meanwhile, recovery moves need not only cross the weekly resistance line, around 0.6365 at the latest, but should also cross the monthly high surrounding 0.6475 to lure the NZD/USD bulls.
It’s worth noting that the August month’s peak near 0.6470 adds strength to the 0.6470-75 resistance area.
During the quote's sustained trading beyond 0.6475, the 61.8% Fibonacci Expansion (FE) of the pair's moves from November 28 to December 05, close to 0.6510, will be on the NZD/USD buyer's radar.
Overall, NZD/USD is likely to remain weak for the short term and the sellers can regain control on a successful break of 0.6300.
NZD/USD: Hourly chart
Trend: Limited downside expected
Information on these pages contains forward-looking statements that involve risks and uncertainties. Markets and instruments profiled on this page are for informational purposes only and should not in any way come across as a recommendation to buy or sell in these assets. You should do your own thorough research before making any investment decisions. FXStreet does not in any way guarantee that this information is free from mistakes, errors, or material misstatements. It also does not guarantee that this information is of a timely nature. Investing in Open Markets involves a great deal of risk, including the loss of all or a portion of your investment, as well as emotional distress. All risks, losses and costs associated with investing, including total loss of principal, are your responsibility. The views and opinions expressed in this article are those of the authors and do not necessarily reflect the official policy or position of FXStreet nor its advertisers. The author will not be held responsible for information that is found at the end of links posted on this page.
If not otherwise explicitly mentioned in the body of the article, at the time of writing, the author has no position in any stock mentioned in this article and no business relationship with any company mentioned. The author has not received compensation for writing this article, other than from FXStreet.
FXStreet and the author do not provide personalized recommendations. The author makes no representations as to the accuracy, completeness, or suitability of this information. FXStreet and the author will not be liable for any errors, omissions or any losses, injuries or damages arising from this information and its display or use. Errors and omissions excepted.
The author and FXStreet are not registered investment advisors and nothing in this article is intended to be investment advice.
Recommended content
Editors’ Picks
EUR/USD edges lower toward 1.0700 post-US PCE

EUR/USD stays under modest bearish pressure but manages to hold above 1.0700 in the American session on Friday. The US Dollar (USD) gathers strength against its rivals after the stronger-than-forecast PCE inflation data, not allowing the pair to gain traction.
GBP/USD retreats to 1.2500 on renewed USD strength

GBP/USD lost its traction and turned negative on the day near 1.2500. Following the stronger-than-expected PCE inflation readings from the US, the USD stays resilient and makes it difficult for the pair to gather recovery momentum.
Gold struggles to hold above $2,350 following US inflation

Gold turned south and declined toward $2,340, erasing a large portion of its daily gains, as the USD benefited from PCE inflation data. The benchmark 10-year US yield, however, stays in negative territory and helps XAU/USD limit its losses.
Bitcoin Weekly Forecast: BTC’s next breakout could propel it to $80,000 Premium

Bitcoin’s recent price consolidation could be nearing its end as technical indicators and on-chain metrics suggest a potential upward breakout. However, this move would not be straightforward and could punish impatient investors.
Week ahead – Hawkish risk as Fed and NFP on tap, Eurozone data eyed too

Fed meets on Wednesday as US inflation stays elevated. Will Friday’s jobs report bring relief or more angst for the markets? Eurozone flash GDP and CPI numbers in focus for the Euro.