|

NZD/USD Price Analysis: Fades bounce off 200-SMA below 0.6390 resistance confluence

  • NZD/USD struggles to defend weekly gains despite keeping recent technical breakouts.
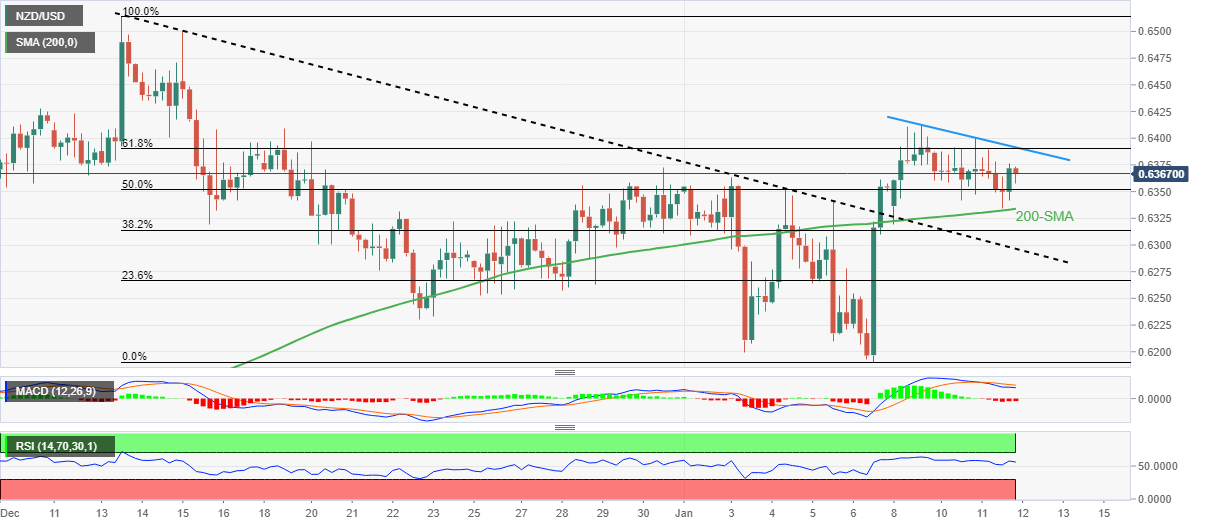
  • Convergence of weekly resistance line, 61.8% Fibonacci retracement level guards immediate upside amid bearish MACD signals.
  • Sustained trading beyond 200-SMA, previous resistance line from early December keeps buyers hopeful.

NZD/USD retreats to 0.6370 as bulls take a breather ahead of the key inflation data from China and the US on early Thursday.

In doing so, the Kiwi pair fades the previous day’s bounce off the 200-Simple Moving Average (SMA). Also adding strength to the pullback moves could be the bearish MACD signals.

Even so, the NZD/USD buyers defend Friday’s upside break of the one-month-old descending resistance line, now support, as well as the 200-SMA. On the same line is the firmer RSI (14) line, not overbought.

Hence, the NZD/USD price is likely to struggle despite keeping the latest bullish signals.

That said, a convergence of the weekly descending trend line joins the 61.8% Fibonacci retracement level of the pair’s December-January downturn, around 0.6390, appears a tough nut to crack for the NZD/USD bulls.

Following that, the monthly high around 0.6415 appears additional upside filter for the quote to cross to justify the traders’ bullish bias.

In a case where the NZD/USD remains firmer past 0.6415, the odds of witnessing a run-up toward the previous monthly peak of 0.6514 can’t be ruled out.

Meanwhile, the 200-SMA and the aforementioned resistance-turned-support line, close to 0.6335 and 0.6295 in that order, restrict the short-term downside of the NZD/USD pair.

If the Kiwi pair sellers keep the reins past 0.6295, the recent hopes of witnessing a north-run take a backseat as prices could challenge the monthly low of 0.6190.

NZD/USD: Four-hour chart

Trend: Pullback expected

Additional important levels

Overview
Today last price0.6367
Today Daily Change-0.0004
Today Daily Change %-0.06%
Today daily open0.6371
 
Trends
Daily SMA200.6324
Daily SMA500.6235
Daily SMA1000.6043
Daily SMA2000.6219
 
Levels
Previous Daily High0.6391
Previous Daily Low0.6342
Previous Weekly High0.6363
Previous Weekly Low0.619
Previous Monthly High0.6514
Previous Monthly Low0.623
Daily Fibonacci 38.2%0.6361
Daily Fibonacci 61.8%0.6372
Daily Pivot Point S10.6345
Daily Pivot Point S20.6319
Daily Pivot Point S30.6296
Daily Pivot Point R10.6394
Daily Pivot Point R20.6417
Daily Pivot Point R30.6443

Author

Anil Panchal

Anil Panchal

FXStreet

Anil Panchal has nearly 15 years of experience in tracking financial markets. With a keen interest in macroeconomics, Anil aptly tracks global news/updates and stays well-informed about the global financial moves and their implications.

More from Anil Panchal
Share:

Markets move fast. We move first.

Orange Juice Newsletter brings you expert driven insights - not headlines. Every day on your inbox.

By subscribing you agree to our Terms and conditions.

Editor's Picks

EUR/USD holds steady near 1.1750 on first trading day of 2026

EUR/USD stays calm on Friday and trades in a narrow channel at around 1.1750 as trading conditions remain thin following the New Year holiday and ahead of the weekend. The economic calendar will not feature any high-impact data releases.

GBP/USD struggles to gain traction, stabilizes above 1.3450

After testing 1.3400 on the last day of 2025, GBP/USD managed to stage a rebound. Nevertheless, the pair finds it difficult to gather momentum and moves sideways above 1.3450 as market participants remain in holiday mood.

Gold climbs toward $4,400 following deep correction

Gold reverses its direction and advances toward $4,400 after suffering heavy losses amid profit-taking before the New Year holiday. Growing expectations for a dovish Fed policy and persistent geopolitical risks seem to be helping XAU/USD stretch higher.

Cardano gains early New Year momentum, bulls target falling wedge breakout

Cardano kicks off the New Year on a positive note and is extending gains, trading above $0.36 at the time of writing on Friday. Improving on-chain and derivatives data point to growing bullish interest, while the technical outlook keeps an upside breakout in focus.

Economic outlook 2026-2027 in advanced countries: Solidity test

After a year marked by global economic resilience and ending on a note of optimism, 2026 looks promising and could be a year of solid economic performance. In our baseline scenario, we expect most of the supportive factors at work in 2025 to continue to play a role in 2026.

Crypto market outlook for 2026

Year 2025 was volatile, as crypto often is.  Among positive catalysts were favourable regulatory changes in the U.S., rise of Digital Asset Treasuries (DAT), adoption of AI and tokenization of Real-World-Assets (RWA).