|

NZD/USD Price Analysis: Edges higher past 0.6300 within weekly bullish channel

  • NZD/USD reverses the previous day’s pullback form one-month high inside immediate rising channel.
  • Bullish chart formation contrasts with oscillators suggesting pullback in Kiwi prices.
  • Bears need to break 0.6300 for re-entry, 0.6385-90 appears a tough nut to crack for buyers.

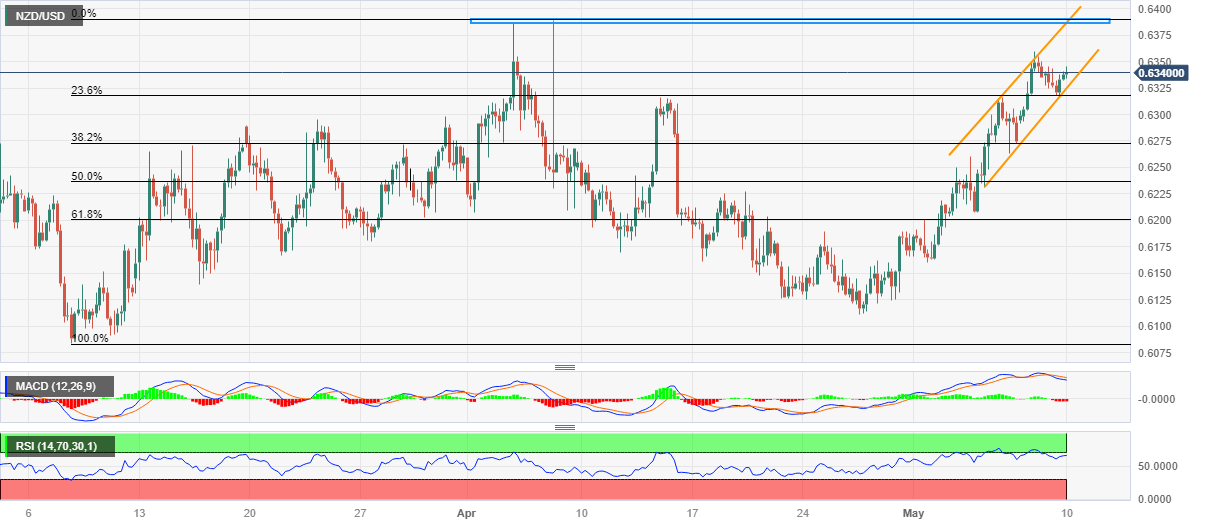
NZD/USD clings to mild gains around 0.6340 as it seesaws within a weekly ascending trend channel during early Wednesday. In doing so, the Kiwi pair reverses the previous day’s corrective pullback from the one-month high while approaching the short-term key resistance confluence on the US Consumer Price Index (CPI) release day.

It’s worth noting, however, that the bearish MACD signals and nearly overbought RSI (14) hint at the NZD/USD pair’s pullback.

The same highlights the bottom line of an aforementioned bullish channel, close to 0.6325. Also acting as short-term key support is the mid-April swing high near 0.6315 and the 0.6300 round figure.

In a case where the NZD/USD bears keep the reins past 0.6300, the odds of witnessing the pair’s further downside towards the 50% and 61.8% Fibonacci retracement levels of March-April upside, near 0.6235 and 0.6200 in that order, can’t be ruled out.

On the flip side, the latest peak of around 0.6360 precedes the 0.6385-90 resistance confluence, comprising the stated channel’s top line and tops marked in April, to prod the NZD/USD buyers.

Even if the Kiwi pair manages to cross the 0.6390 hurdle, the 0.6400 psychological magnet may act as an extra check for the buyers.

NZD/USD: Four-hour chart

Trend: Limited upside expected

NZD/USD

Overview
Today last price0.634
Today Daily Change0.0005
Today Daily Change %0.08
Today daily open0.6335
 
Trends
Daily SMA200.621
Daily SMA500.6217
Daily SMA1000.6279
Daily SMA2000.616
 
Levels
Previous Daily High0.635
Previous Daily Low0.6318
Previous Weekly High0.6316
Previous Weekly Low0.616
Previous Monthly High0.6389
Previous Monthly Low0.6111
Daily Fibonacci 38.2%0.633
Daily Fibonacci 61.8%0.6338
Daily Pivot Point S10.6318
Daily Pivot Point S20.6302
Daily Pivot Point S30.6286
Daily Pivot Point R10.6351
Daily Pivot Point R20.6367
Daily Pivot Point R30.6383

Author

Anil Panchal

Anil Panchal

FXStreet

Anil Panchal has nearly 15 years of experience in tracking financial markets. With a keen interest in macroeconomics, Anil aptly tracks global news/updates and stays well-informed about the global financial moves and their implications.

More from Anil Panchal
Share:

Editor's Picks

EUR/USD struggles to build on recent rebound, holds above 1.1550

EUR/USD trades marginally lower on the day but holds above 1.1550 in the American session, following Thursday's rebound. The pair holds near its intraday high as the US Dollar remains pressured by hopes the Middle East conflict will soon come to an end.

GBP/USD hovers around 1.3400 as investors await war clarity

GBP/USD remains near its daily open, not far from 1.3400, in the second half of Friday's session. The US Dollar lost its previous intraday strength and weakens as investors await clarity on the US-Iran war.

Gold stabilizes above $4,200 as wait-and-see continues

After rising more than 3% on Thursday, Gold (XAU/USD) stabilized around the $4,200 mark in the American session on Friday. The US dollar seesaws between gains and losses, but remains within familiar levels as investors remain skeptical yet hopeful about a resolution to the Middle East conflict.

Crypto Today: Bitcoin, Ethereum, XRP recovery slows amid incessant capital outflows

The cryptocurrency remains in a broader corrective bias on Friday, despite majors such as Bitcoin (BTC), Ethereum (ETH), and Ripple (XRP) holding slightly higher than early-week support levels.

SpaceX launches 24% higher at Friday debut
Space Exploration Technologies (SPCX), aka SpaceX, zoomed 24% higher soon after the start of its first IPO trading day on Friday. Shares of the rocket and artificial intelligence (AI) company founded by Elon Musk began trading at about 11:46 am EST and quickly gained speed.
4.2% headline, 0.2% core: Why the Fed's next hike may be targeting the wrong problem

May's CPI put headline inflation at 4.2% on the year, up from 3.8% in April and the hottest reading since April 2023, while core prices rose just 0.2% on the month, undershooting the 0.3% consensus and halving April's pace.