NZD/USD Price Analysis: Bulls lurking near 0.6250, rallies to 0.6340 eyed


  • NZD/USD is heavy against a 38.2% Fibo area near 0.6280.
  • 0.6252 could be the last area of support before a run towards liquidity around 0.6340. 

NZD/USD was heavily sold-off on Wednesday before it managed to draw in a bid on the back of US dollar weakness, (more on DXY technical analysis here). The moves have created a lot of new market structures which are worthy of a multi-timeframe top-down analysis as follows:

NZD/USD weekly chart

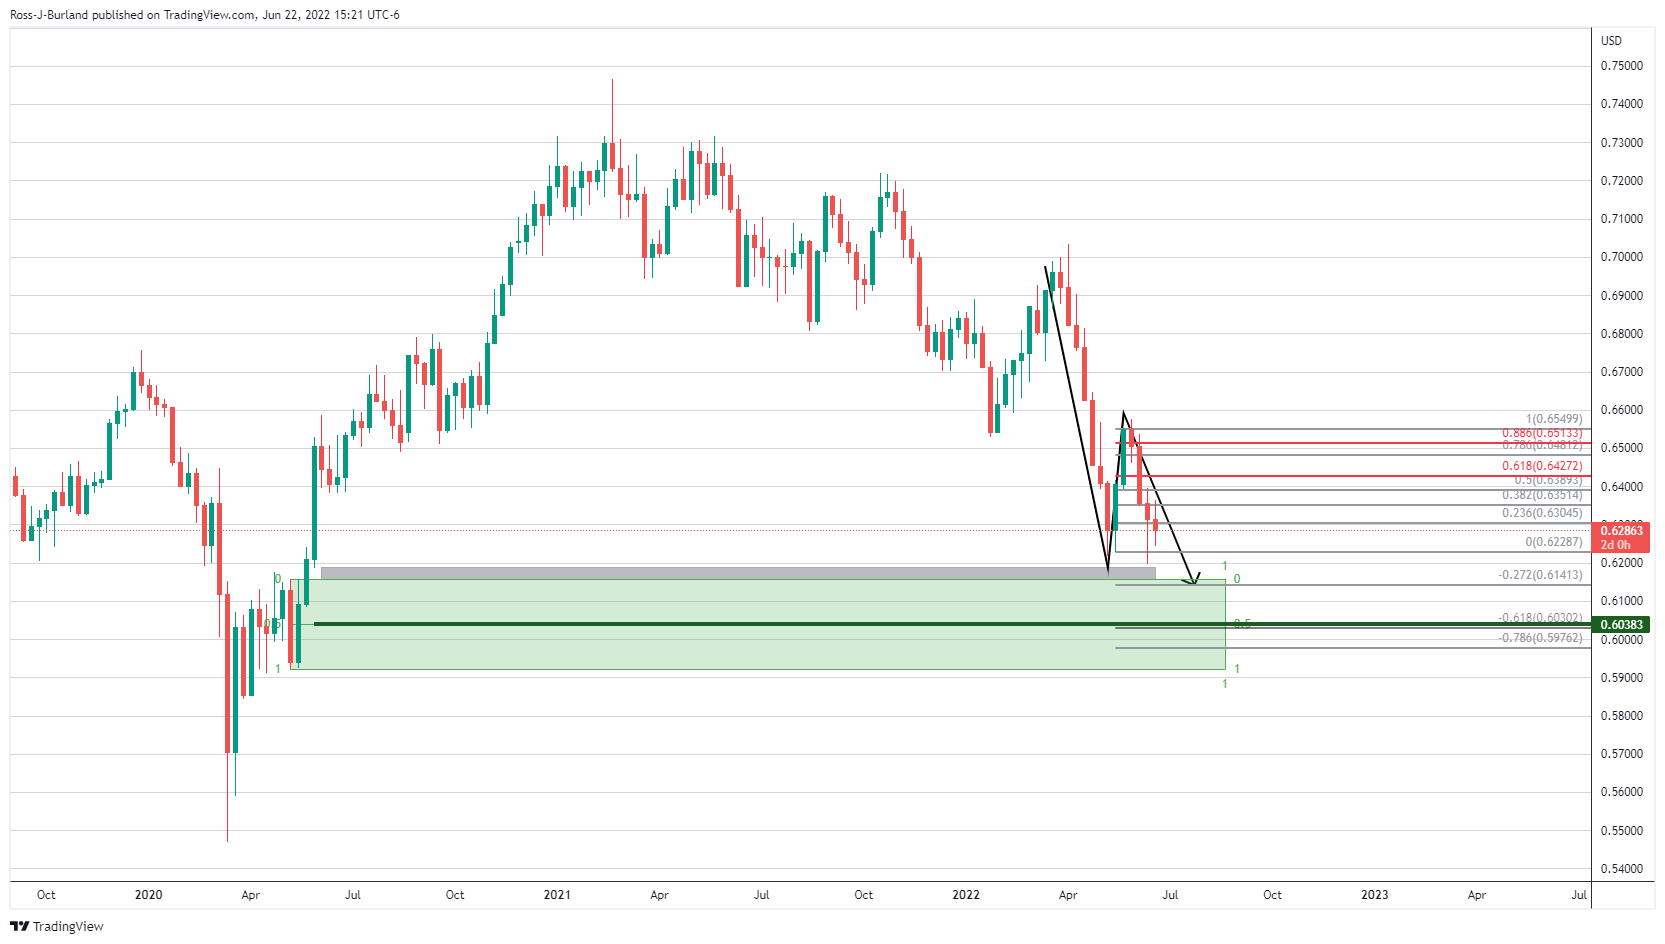
The weekly downtrend remains intact and there are prospects of a move into the grey zone below the market which is a price imbalance near 0.6120 that guards a firm area of demand. The mid point of this demand area is located near 0.6040.

NZD/USD daily charts

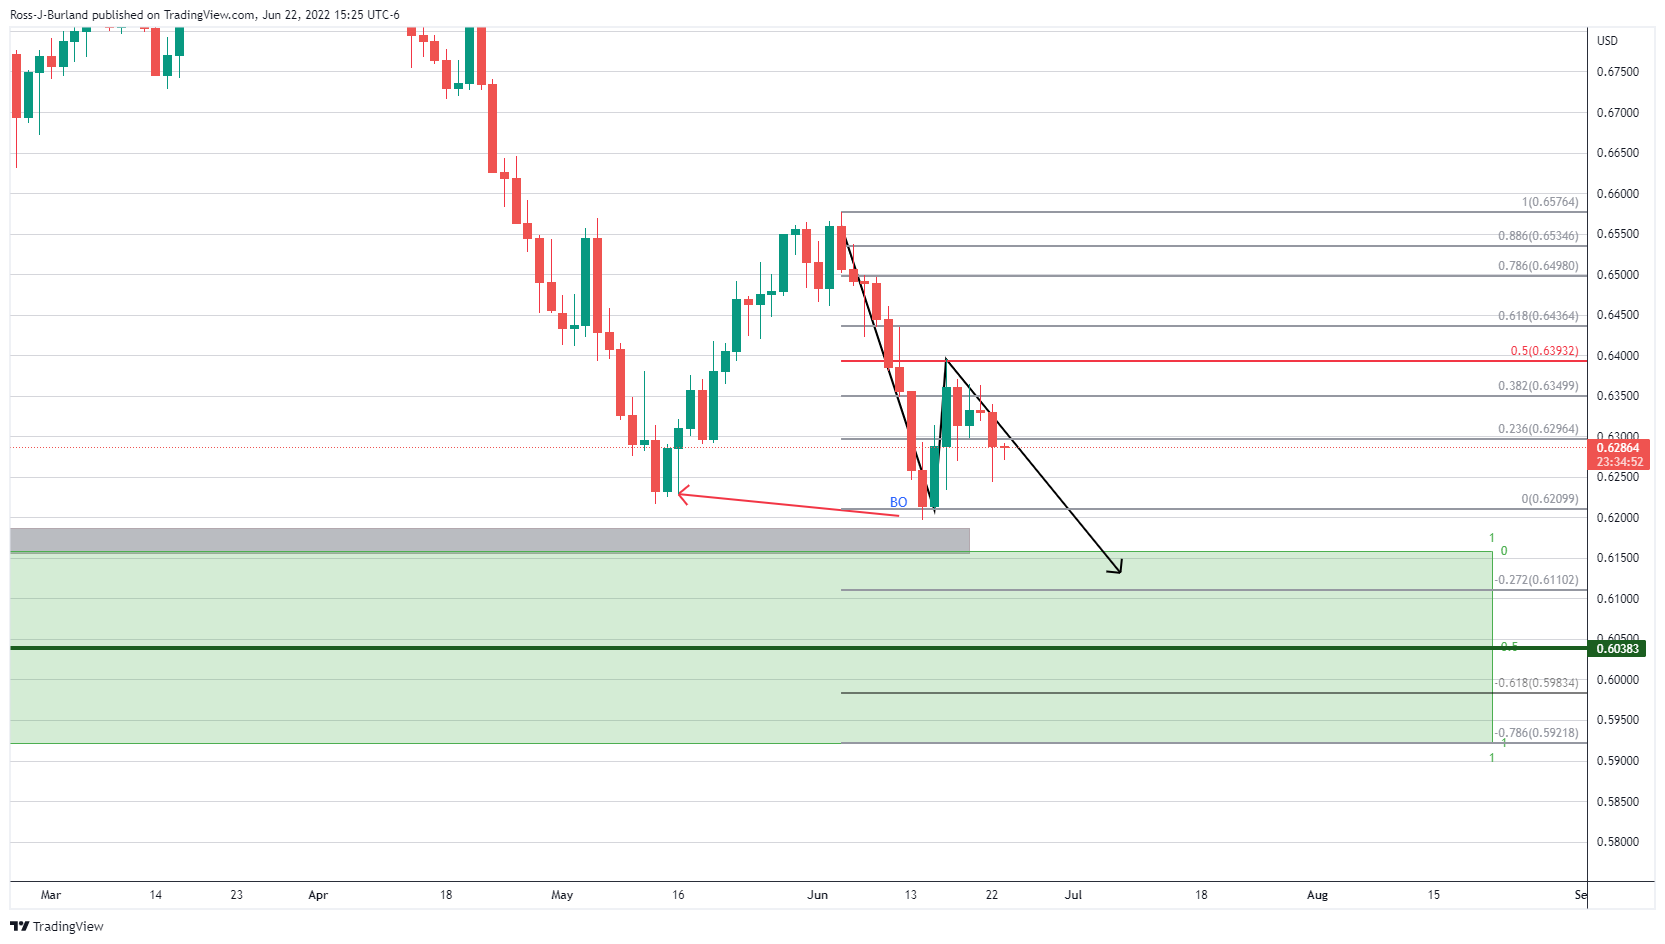
The daily chart's structure was broken to form a lower low from where it has rallied in a 50% mean reversion. The bears took over and the price is making its way in a grind back to the downside and would be expected to continue lower towards the weekly demand area. 

However, when zooming in on the structure, an M-formation is in development.

Zoomed in on the M-formation:

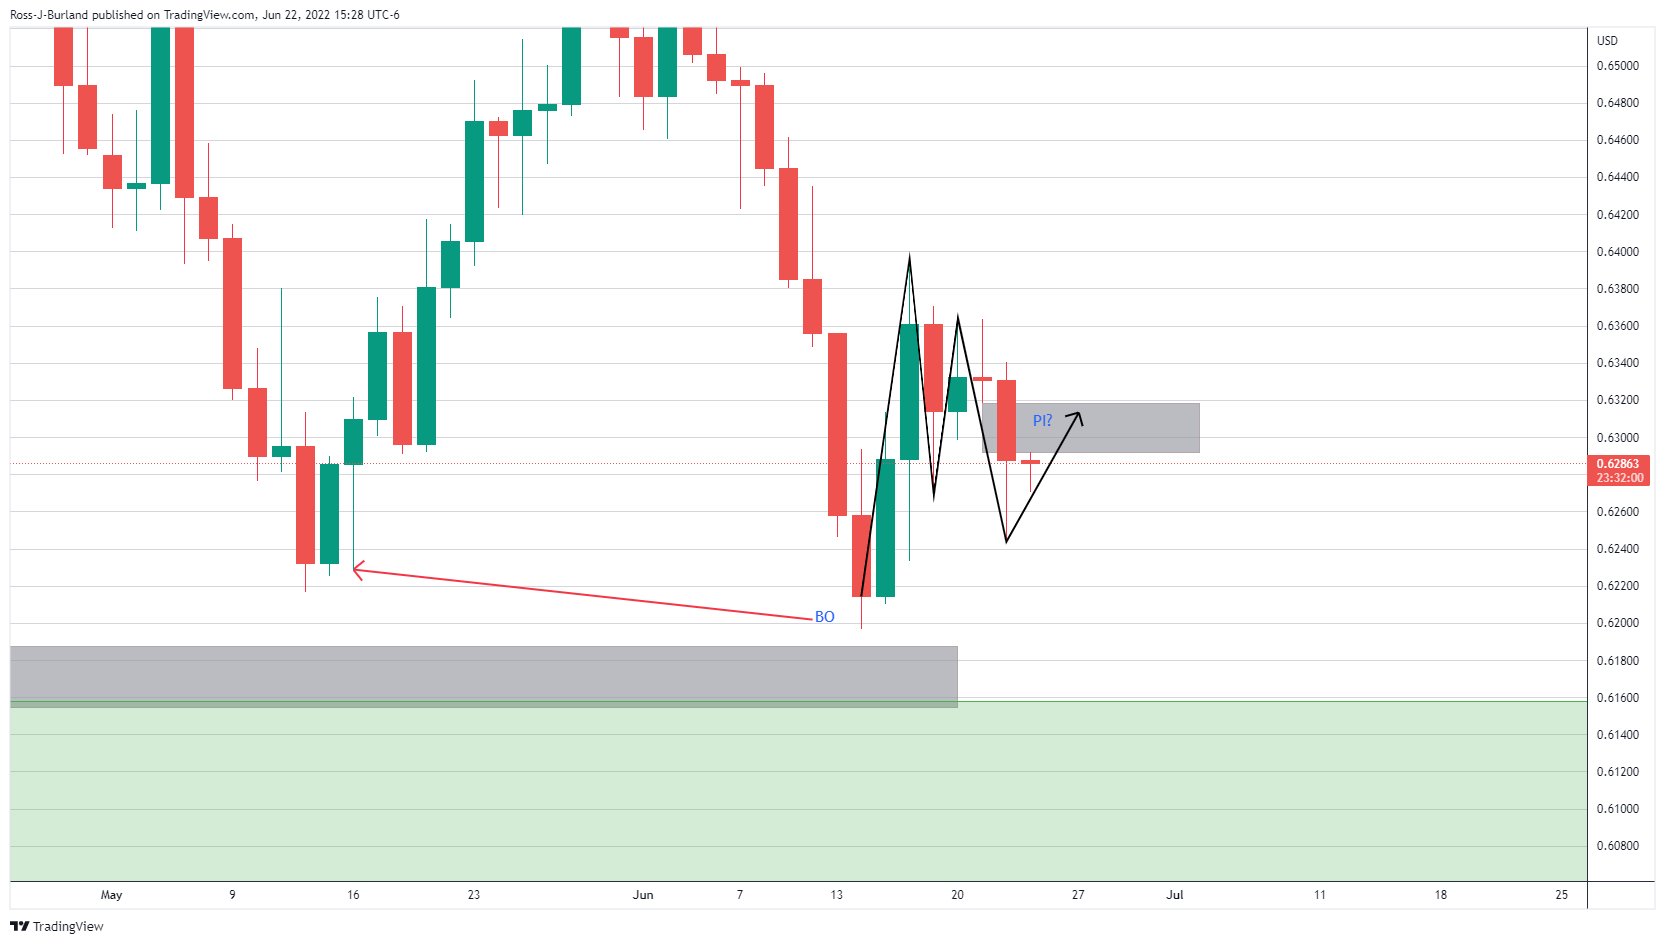
The M-formation is a reversion pattern and the price would be expected to fill any price imbalances left behind towards the neckline, as illustrated above. There is a price imbalance at this juncture, at 0.6318, but the close of the current daily candle will determine whether the price left a void of bids or not for the remaining sessions of the week. Judging by the following short-term analysis, this void of bids is less likely to be mitigated before the end of the day with the bias towards 0.6250.

NZD/USD H4 chart

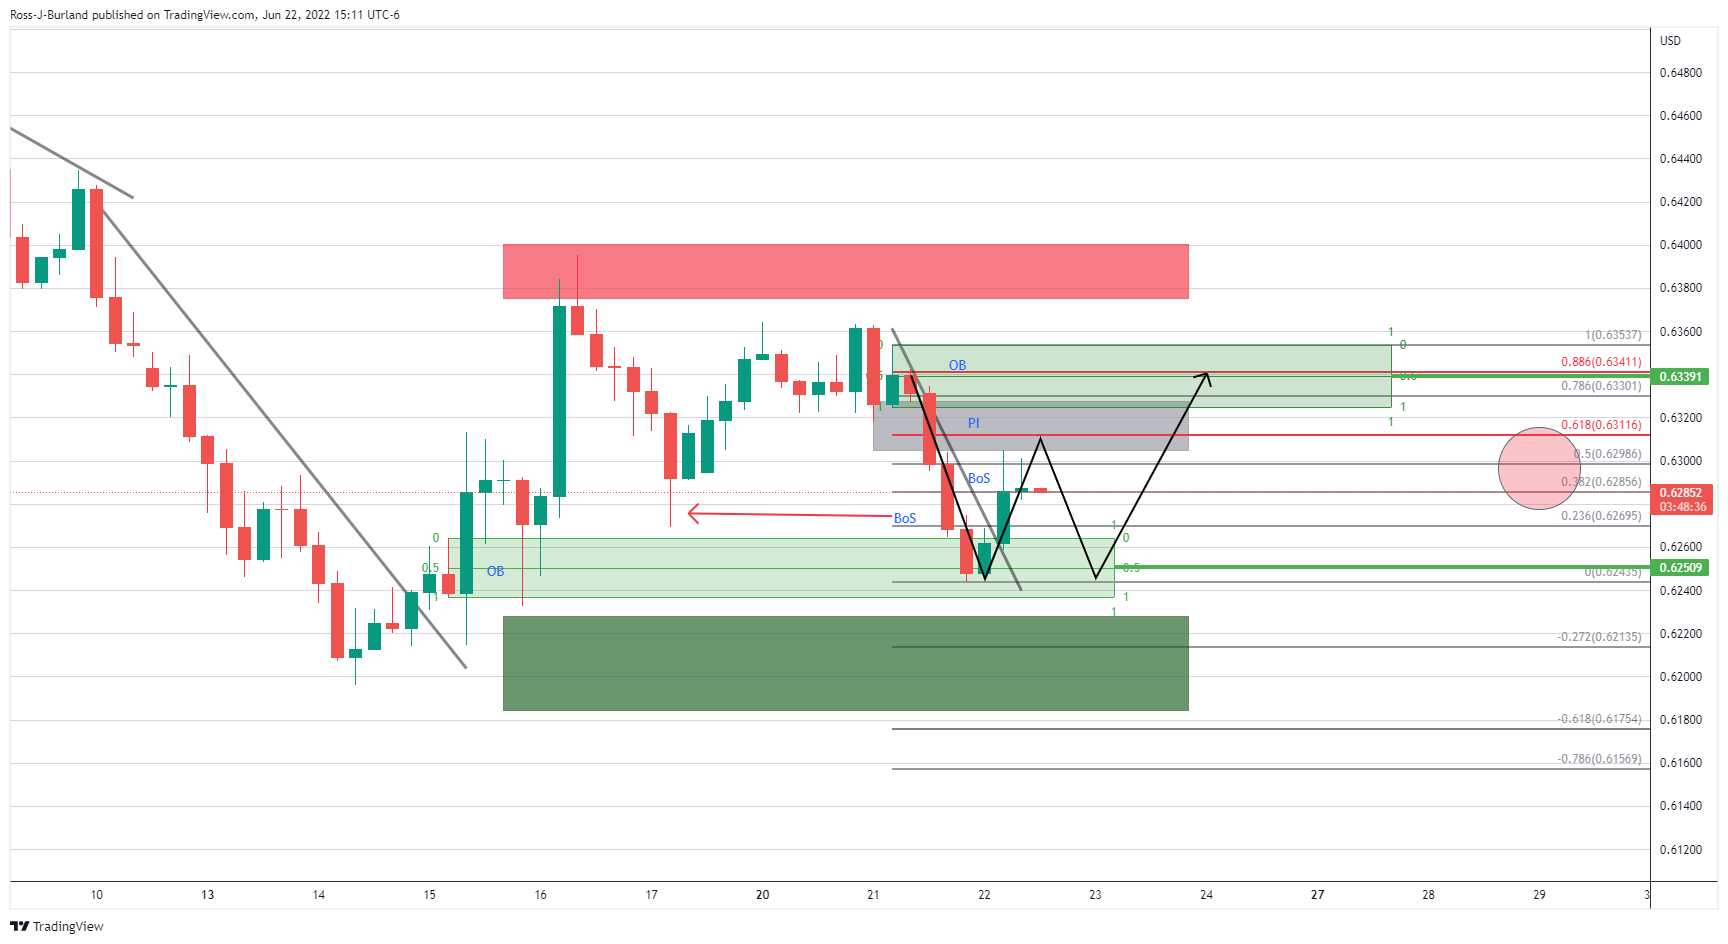
On the 4-hour chart, the schematic is a busy one...

We have a market trying to correct towards the price imbalance (PI) and a 61.8% Fibonacci near 0.6310. However, the 50% mean reversion and 38.2% ratios are holding things up below 0.63 the figure. This leaves the scope for a revisit to the order block (OB) or demand/support area near 0.6250. If bulls commit there, then there will be more gas in the tank for the bird to fly through 0.6310 and towards liquidity higher up in the prior order block that is situated in and around 0.6340.

NZD/USD H1 chart

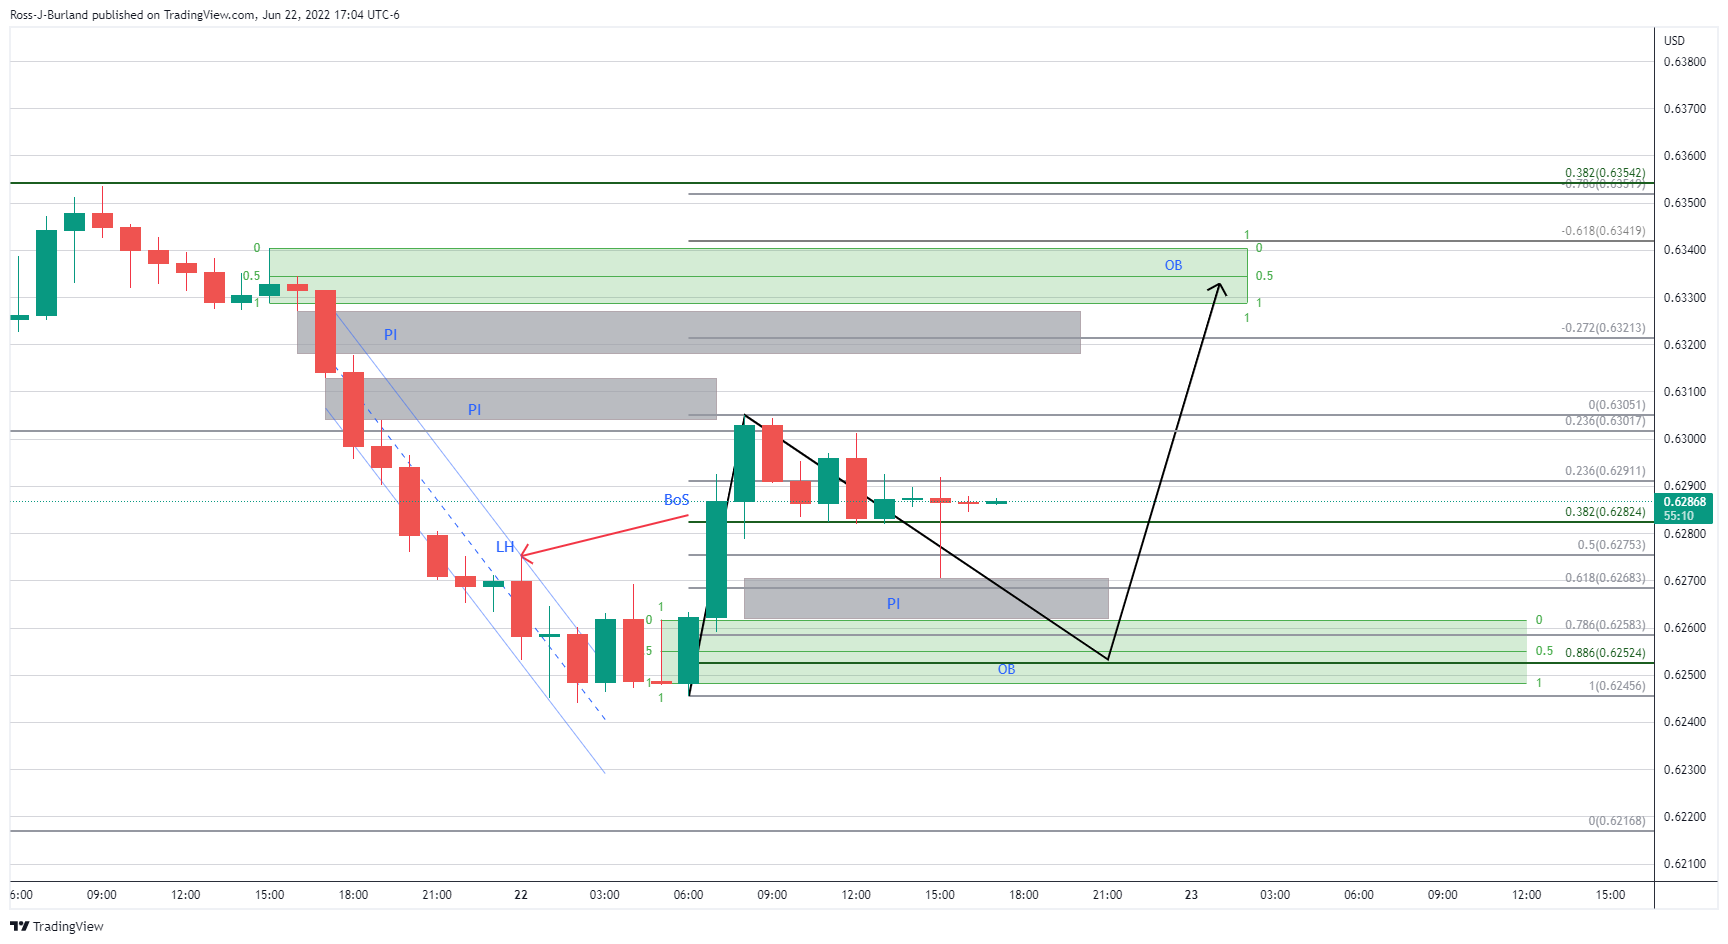
On the hourly time frame, we have had a recent break of structure to the upside. Should the price fail to move higher from the 38.2% Fibo area near 0.6280, then there is a higher probability that the price imbalance between 0.6270 and 0.6261 will be mitigated which guards the mid point of the demand area, or order block (OB) at 0.6252. This would be expected to result in a flurry of bids and a subsequent run towards liquidity towards 0.6340. 

Update:

From a 5-min perspective, with the price breaking structure in accordance with the hourly analysis above, the trade opportunity now is as follows:

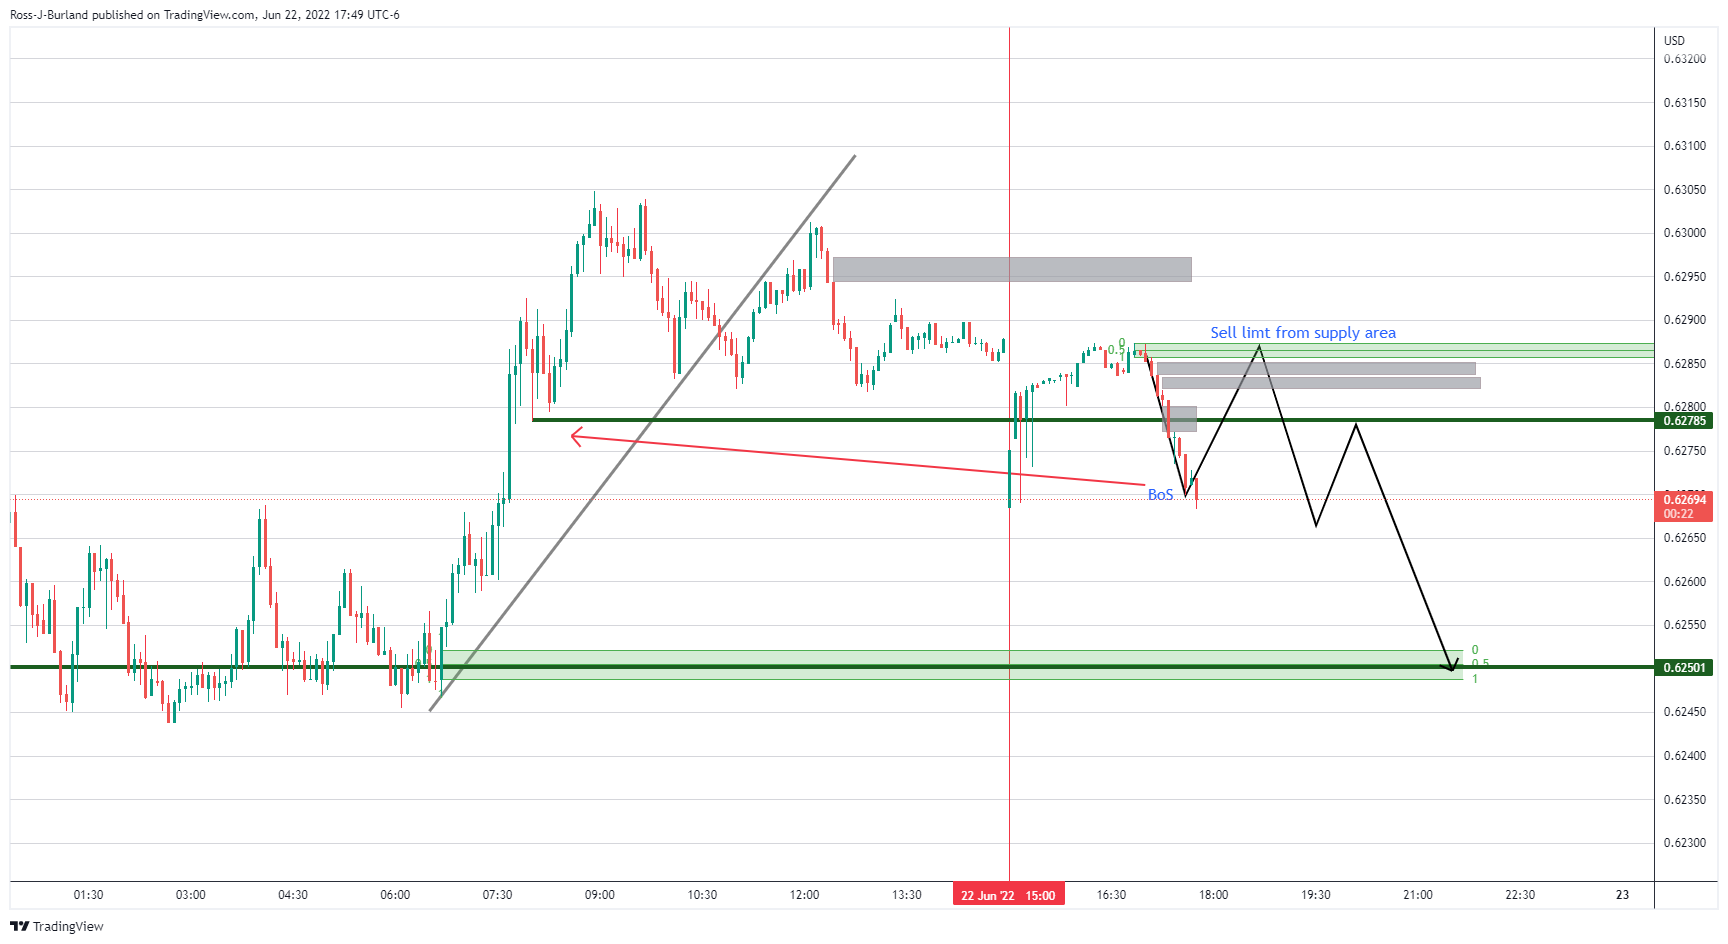
The price would be expected to retrace into the price imbalances (grey areas) and in doing so, the supply area becomes an attractive area to short from given that the market structure has been already broken. 

Share: Feed news

Information on these pages contains forward-looking statements that involve risks and uncertainties. Markets and instruments profiled on this page are for informational purposes only and should not in any way come across as a recommendation to buy or sell in these assets. You should do your own thorough research before making any investment decisions. FXStreet does not in any way guarantee that this information is free from mistakes, errors, or material misstatements. It also does not guarantee that this information is of a timely nature. Investing in Open Markets involves a great deal of risk, including the loss of all or a portion of your investment, as well as emotional distress. All risks, losses and costs associated with investing, including total loss of principal, are your responsibility. The views and opinions expressed in this article are those of the authors and do not necessarily reflect the official policy or position of FXStreet nor its advertisers. The author will not be held responsible for information that is found at the end of links posted on this page.

If not otherwise explicitly mentioned in the body of the article, at the time of writing, the author has no position in any stock mentioned in this article and no business relationship with any company mentioned. The author has not received compensation for writing this article, other than from FXStreet.

FXStreet and the author do not provide personalized recommendations. The author makes no representations as to the accuracy, completeness, or suitability of this information. FXStreet and the author will not be liable for any errors, omissions or any losses, injuries or damages arising from this information and its display or use. Errors and omissions excepted.

The author and FXStreet are not registered investment advisors and nothing in this article is intended to be investment advice.

Recommended content


Recommended content

Editors’ Picks

EUR/USD extends gains above 1.0700, focus on key US data

EUR/USD extends gains above 1.0700, focus on key US data

EUR/USD meets fresh demand and rises toward  1.0750 in the European session on Thursday. Renewed US Dollar weakness offsets the risk-off market environment, supporting the pair ahead of the key US GDP and PCE inflation data. 

EUR/USD News

USD/JPY keeps pushing higher, eyes 156.00 ahead of US GDP data

USD/JPY keeps pushing higher, eyes 156.00 ahead of US GDP data

USD/JPY keeps breaking into its highest chart territory since June of 1990 early Thursday, recapturing 155.50 for the first time in 34 years as the Japanese Yen remains vulnerable, despite looming intervention risks. The focus shifts to Thursday's US GDP report and the BoJ decision on Friday. 

USD/JPY News

Gold closes below key $2,318 support, US GDP holds the key

Gold closes below key $2,318 support, US GDP holds the key

Gold price is breathing a sigh of relief early Thursday after testing offers near $2,315 once again. Broad risk-aversion seems to be helping Gold find a floor, as traders refrain from placing any fresh directional bets on the bright metal ahead of the preliminary reading of the US first-quarter GDP due later on Thursday.

Gold News

Injective price weakness persists despite over 5.9 million INJ tokens burned

Injective price weakness persists despite over 5.9 million INJ tokens burned

Injective price is trading with a bearish bias, stuck in the lower section of the market range. The bearish outlook abounds despite the network's deflationary efforts to pump the price. 

Read more

US Q1 GDP Preview: Economic growth set to remain firm in, albeit easing from Q4

US Q1 GDP Preview: Economic growth set to remain firm in, albeit easing from Q4

The United States Gross Domestic Product (GDP) is seen expanding at an annualized rate of 2.5% in Q1. The current resilience of the US economy bolsters the case for a soft landing. 

Read more

Forex MAJORS

Cryptocurrencies

Signatures