Top 3 Price Prediction: Bitcoin, Ethereum, XRP prepare for a potential New Year rebound
- Bitcoin trades above $88,000, extending a lateral move within a symmetrical triangle pattern after a 1.43% rise on Tuesday.
- Ethereum struggles to resurface above $3,000 as an overhead resistance trendline looms.
- Ripple prepares for a potential breakout of a falling wedge pattern after a 1.45% rise on Tuesday.

Bitcoin (BTC), Ethereum (ETH), and Ripple (XRP) are holding steady on Wednesday after recording minor gains on the previous day. Technically, Bitcoin could extend gains within a triangle pattern while Ethereum and Ripple face critical overhead resistance.
Bitcoin’s New Year rebound might be limited
Bitcoin is trading above $88,000 at press time on Wednesday, holding steady after the 1.43% rise on the previous day. The recent fluctuations in BTC indicate a sideways trend within a symmetrical triangle.
A potential rebound from the support area could test the overhead trendline connecting the November 15 and December 9 highs, near $92,000, as well as the 50-day Exponential Moving Average at $91,829.
The momentum indicators on the daily chart support the thesis of a potential recovery. The Relative Strength Index (RSI) is at 48, inching toward the midpoint, suggesting a decline in selling pressure.
Additionally, the Moving Average Convergence Divergence (MACD) rises with its signal line after a crossover on December 19. However, the close moving average lines bear the risk of a bearish crossover, which would trigger a sell signal if BTC price corrects sharply.
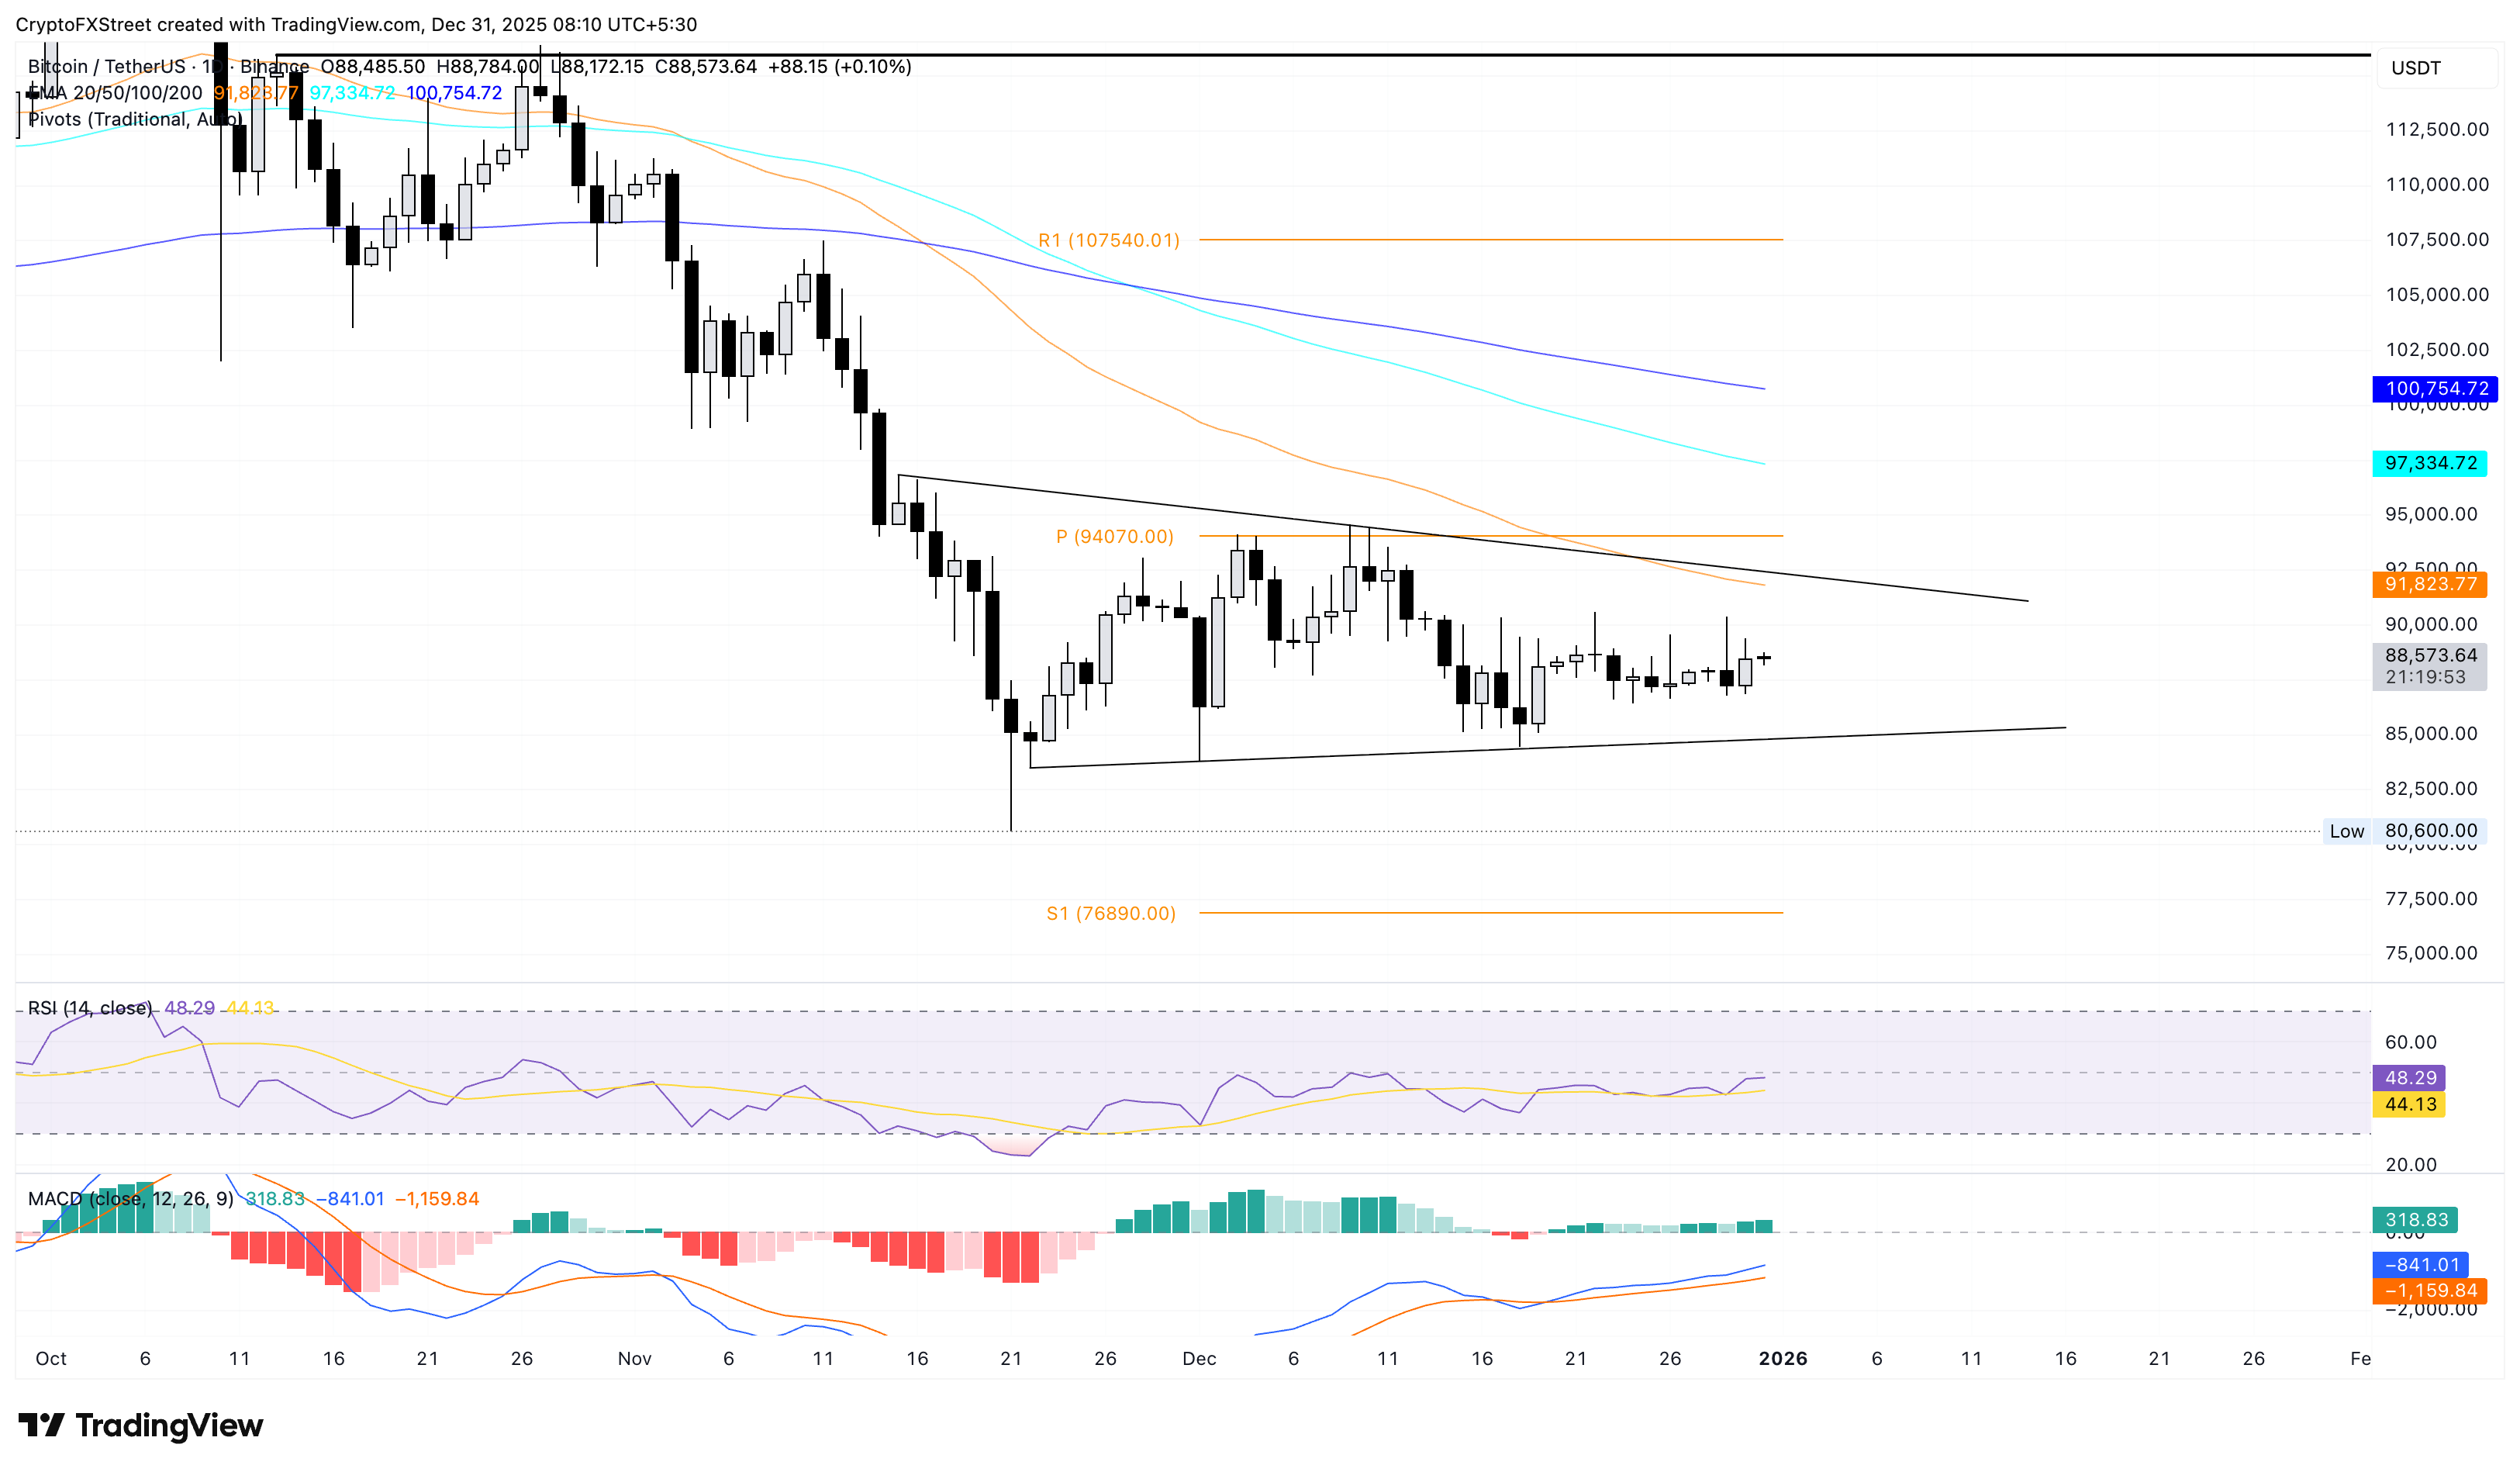
If BTC slips below the support trendline connecting the November 22 and December 1 lows, near $85,000, it could revisit the November 21 low at $80,600.
Ethereum must break this trendline for a New Year rebound
Ethereum faces resistance from an overhead trendline connecting the October 7 and December 10 highs. At the time of writing, Ethereum hovers near $3,000 on Wednesday, retaining the 1.22% gains from the previous day.
If the major altcoin clears the trendline, it could face opposition near the 50-day EMA at $3,120, followed by the R1 Pivot Point at $3,177.
The RSI at 47 remains slightly below the midline as bulls struggle to overcome the bearish pressure. However, the MACD diverging upward from the signal line after a crossover on Saturday sustains the buy indication.
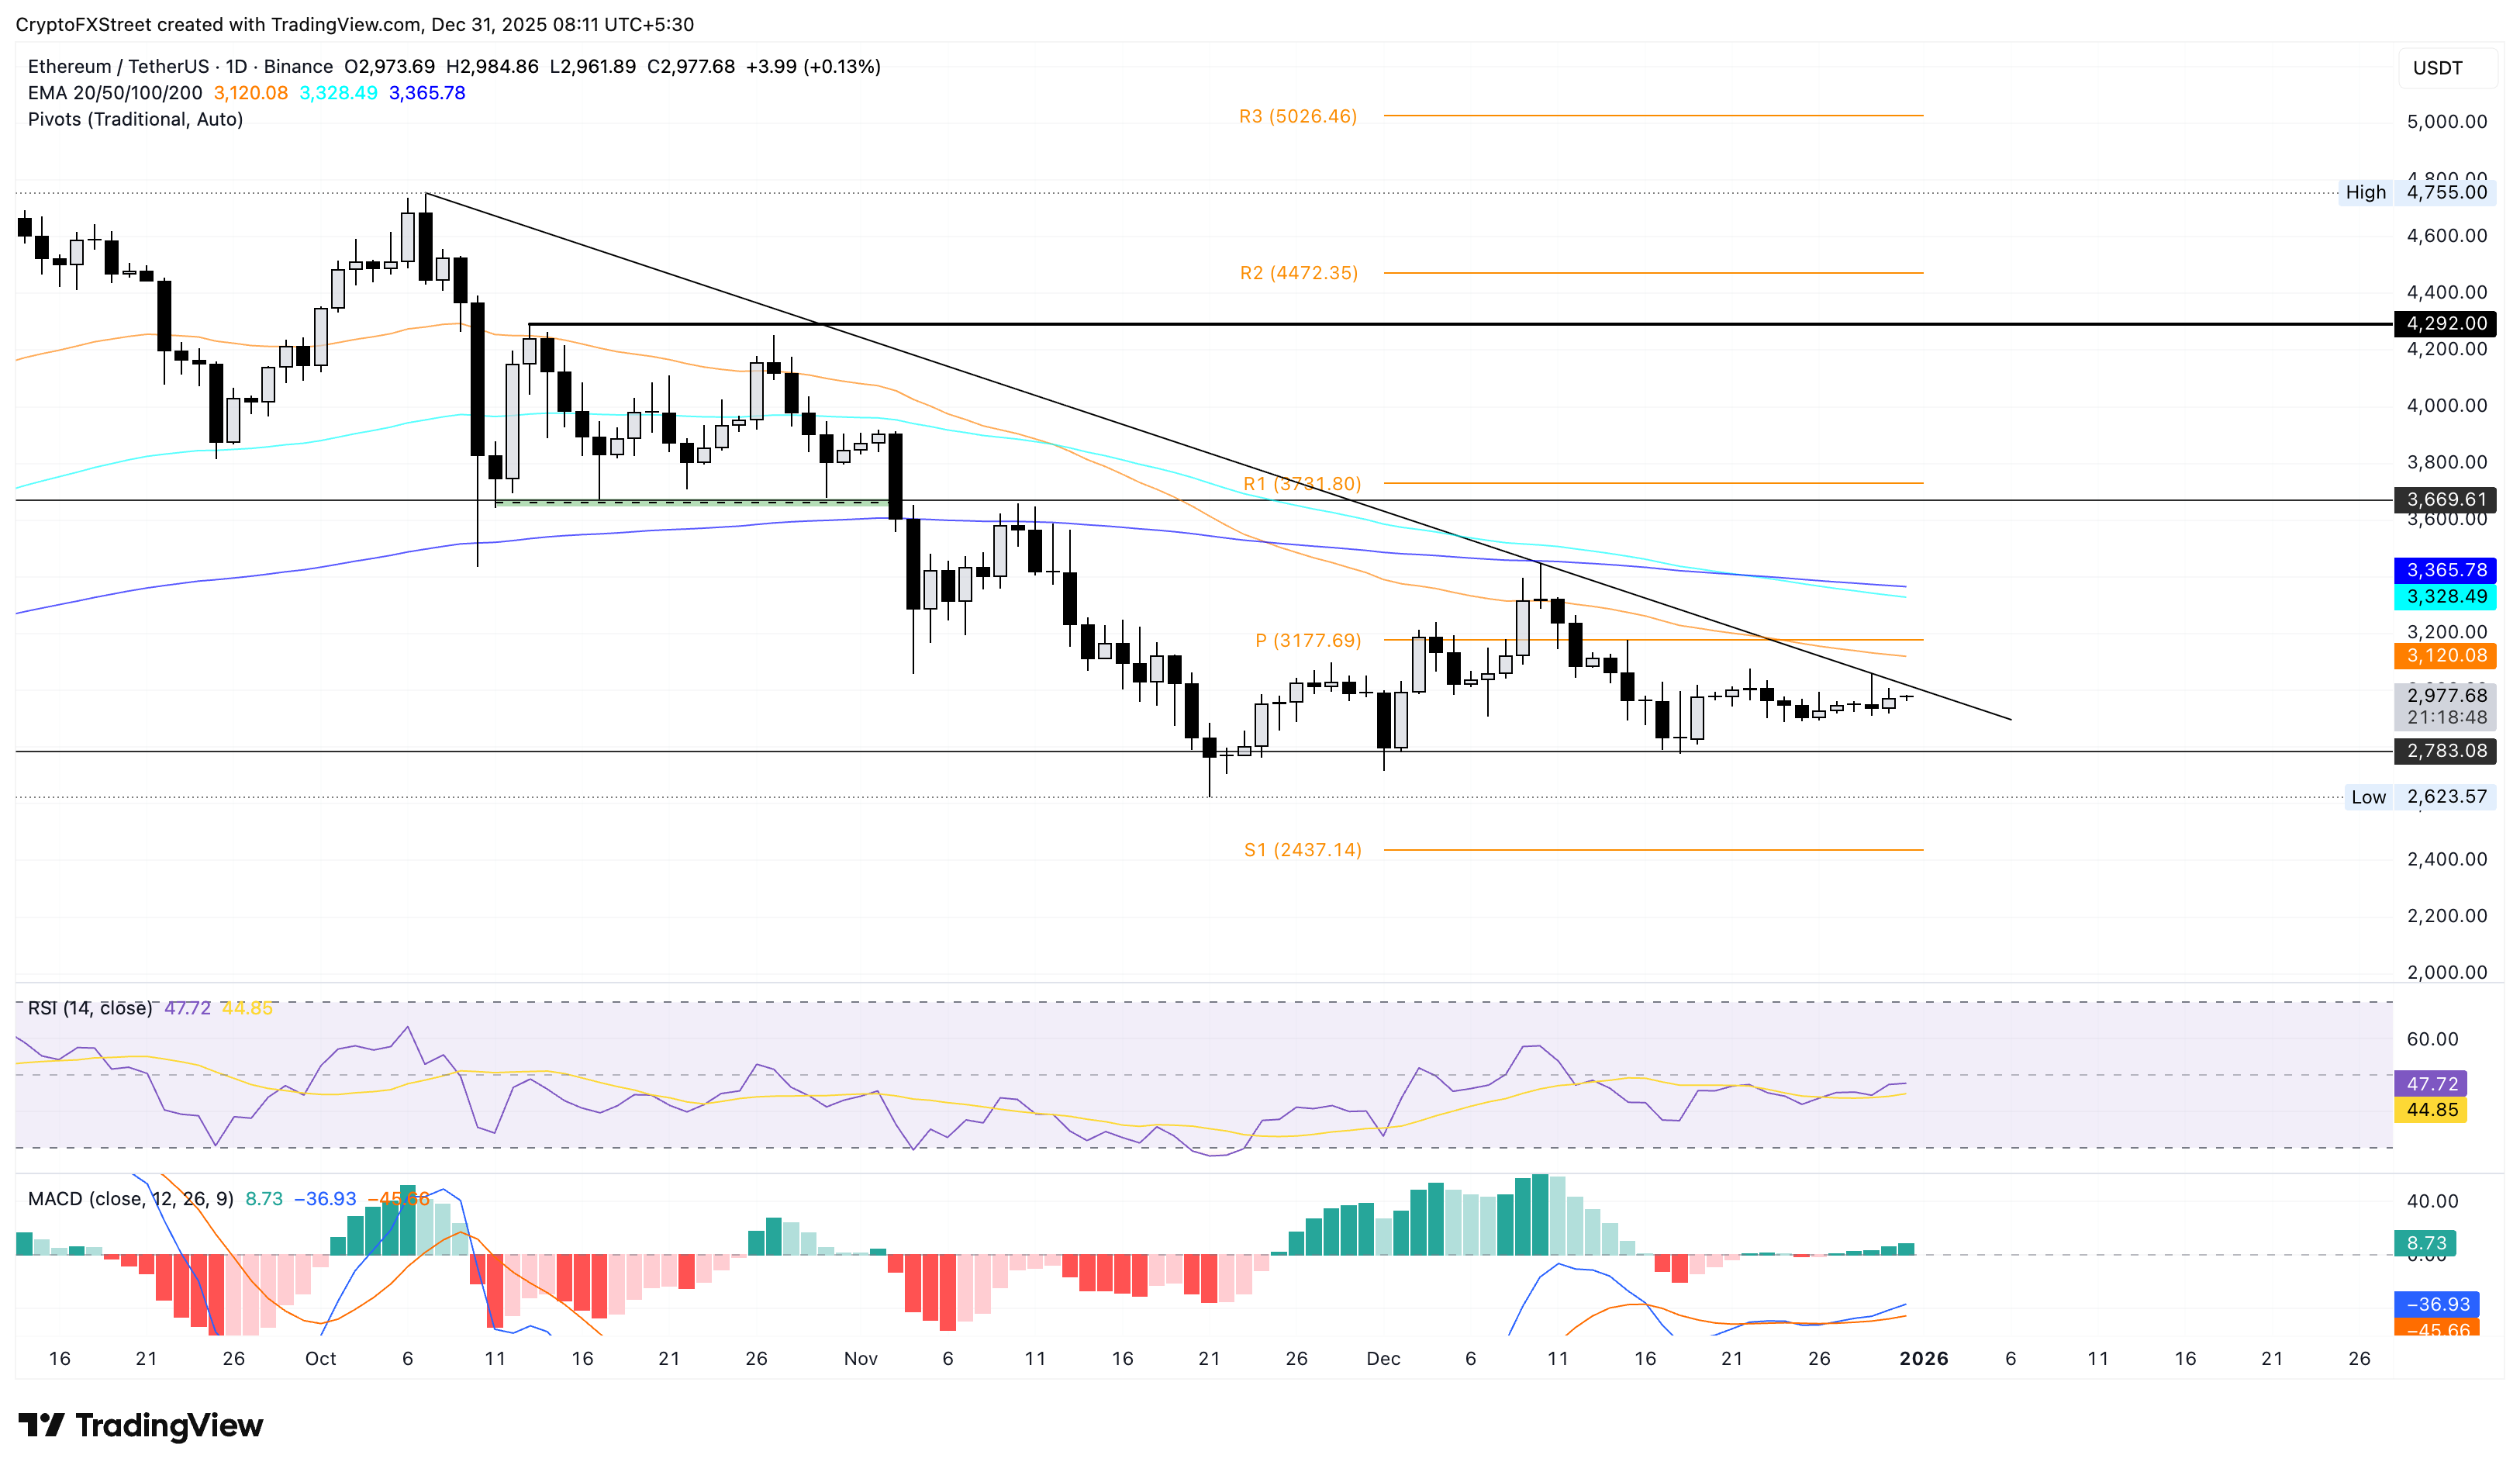
On the flip side, the $2,783 support level, last tested on December 18, could serve as primary support before the November 21 low at $2,623.
Ripple inches closer to breakout of a falling wedge pattern
Similar to Ethereum, Ripple struggles near a resistance trendline connecting the November 13 and December 9 highs, near $1.90. This trendline completes a falling wedge pattern on the daily chart, with a converging support trendline connecting the October 17 and November 4 lows.
If XRP secures a daily close above $1.90, it could confirm a bullish breakout and extend the rally to the 50-day EMA at $2.05.
The RSI is at 42 on the daily chart, maintaining a broadly upward trend after reversing from the oversold boundary on December 18. This suggests a loosening of the bearish grip on XRP, and a move above the halfway line would signal renewed buying pressure.
Additionally, the MACD indicator maintains the buy signal from Saturday's crossover, while successive green histogram bars indicate a rise in bullish momentum.
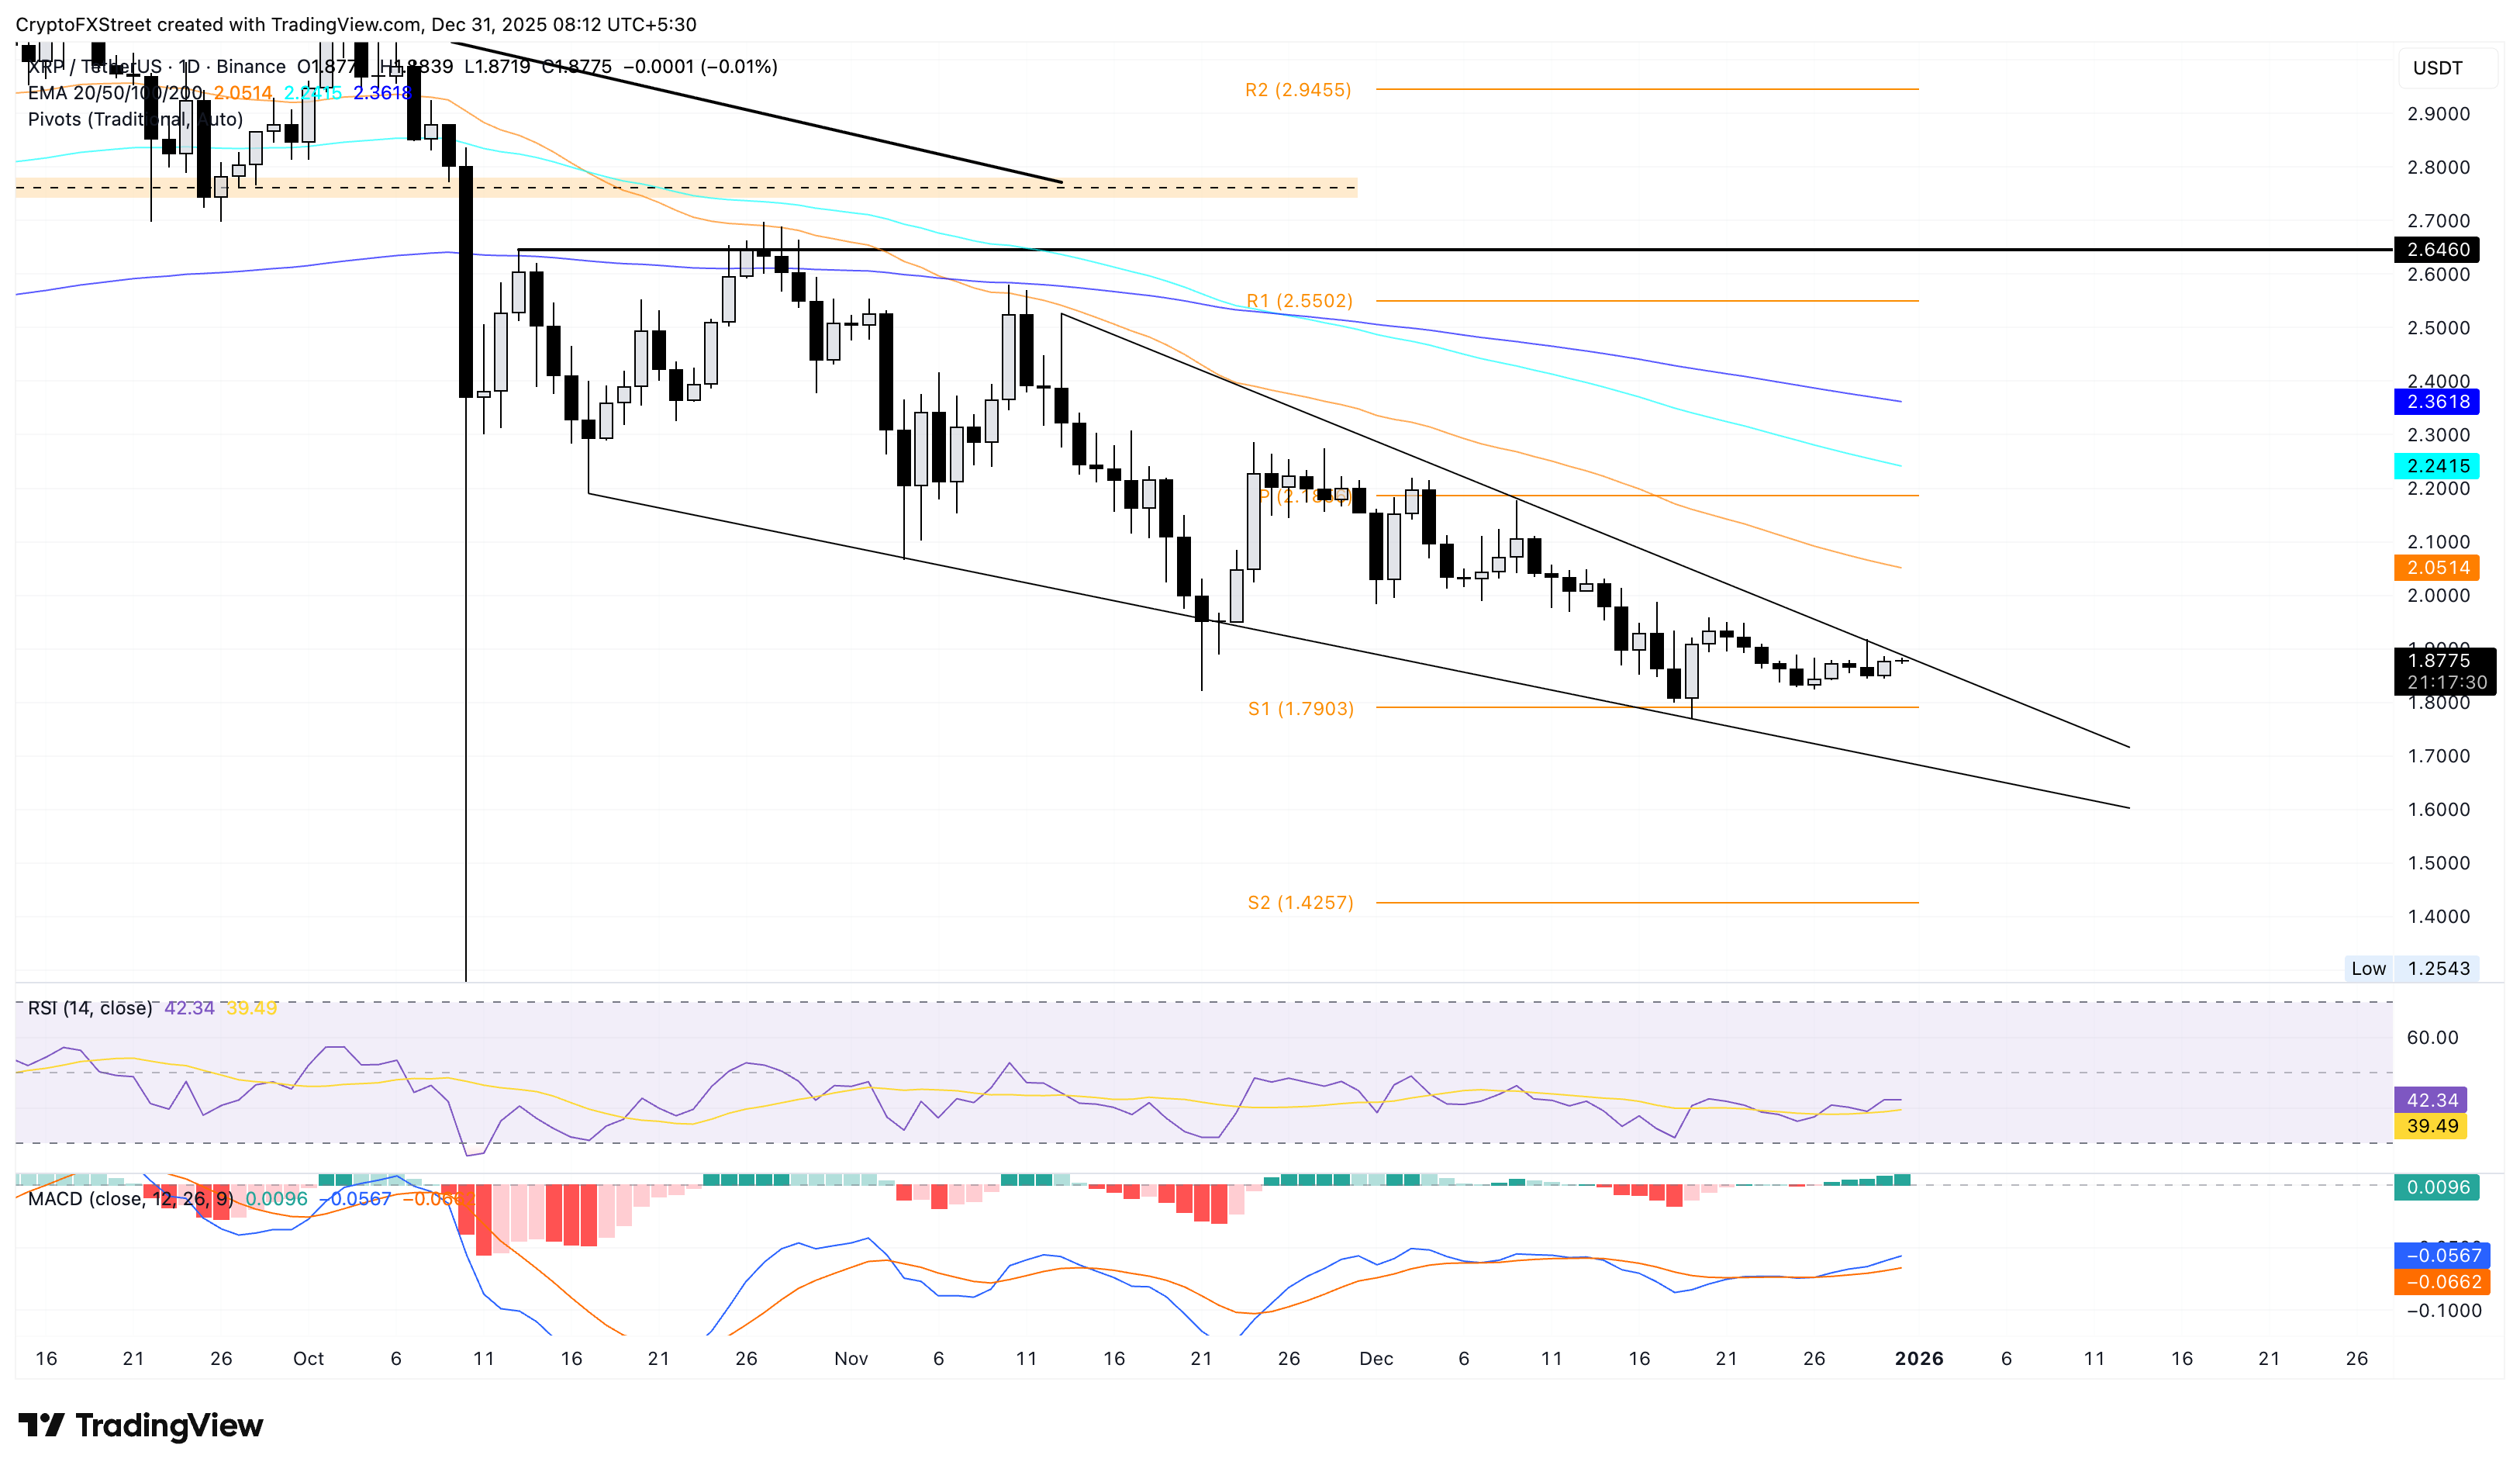
Looking down, if XRP reverses from the $1.90, it could test the S1 Pivot Point at $1.79, followed by the support trendline at $1.68.
(This story was corrected on December 31 at 05:26 GMT to say "November 21 low" instead of "November 21" in the Ethereum price analysis.)
Author

Vishal Dixit
FXStreet
Vishal Dixit holds a B.Sc. in Chemistry from Wilson College but found his true calling in the world of crypto.


