US Dollar Price Analysis: Bears taking out short-term structure, 103 vulnerable of a test below
- DXY is being sold off on the shorter-term time frames, 103.13-eyed near-term, 102.39 thereafter.
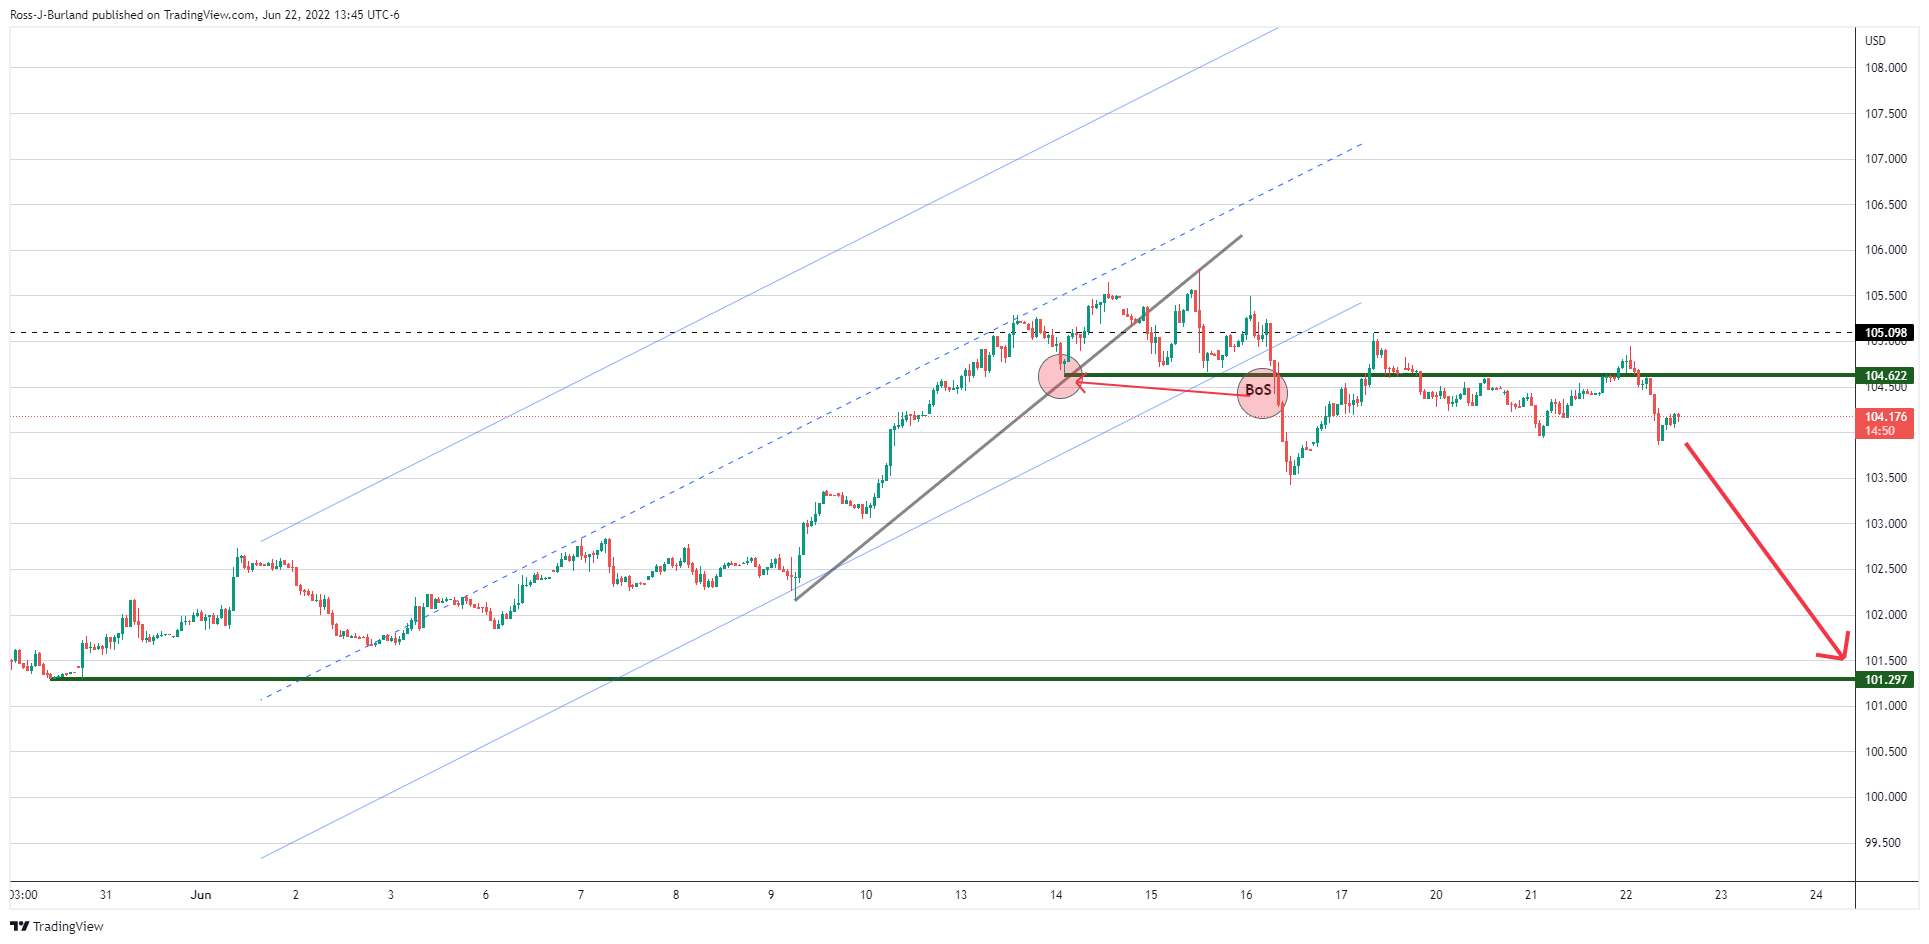
- The bias remains bullish on the daily chart until a break of downside structure, or 101.297.

Despite the persistent message from Fed members that there is a ''need to raise interest rates 'a good deal more' over the coming months,'' the US dollar has been on the back foot.
While it has been breaking the short-term structure and the trend from 101.297, as illustrated below, the long-term bullish playbook remains very much in play, at least from a technical standpoint.
The following is a top-down analysis that arrives at a bullish bias for the longer term, albeit noting the prospects of a near-term significant correction on the shorter-term charts.
DXY H1 charts
As illustrated in the hourly time frame, the price has broken the structure of the bullish short-term trend and the market is biased to the downside. Zooming in, we can see the market structure broken down through a lense:
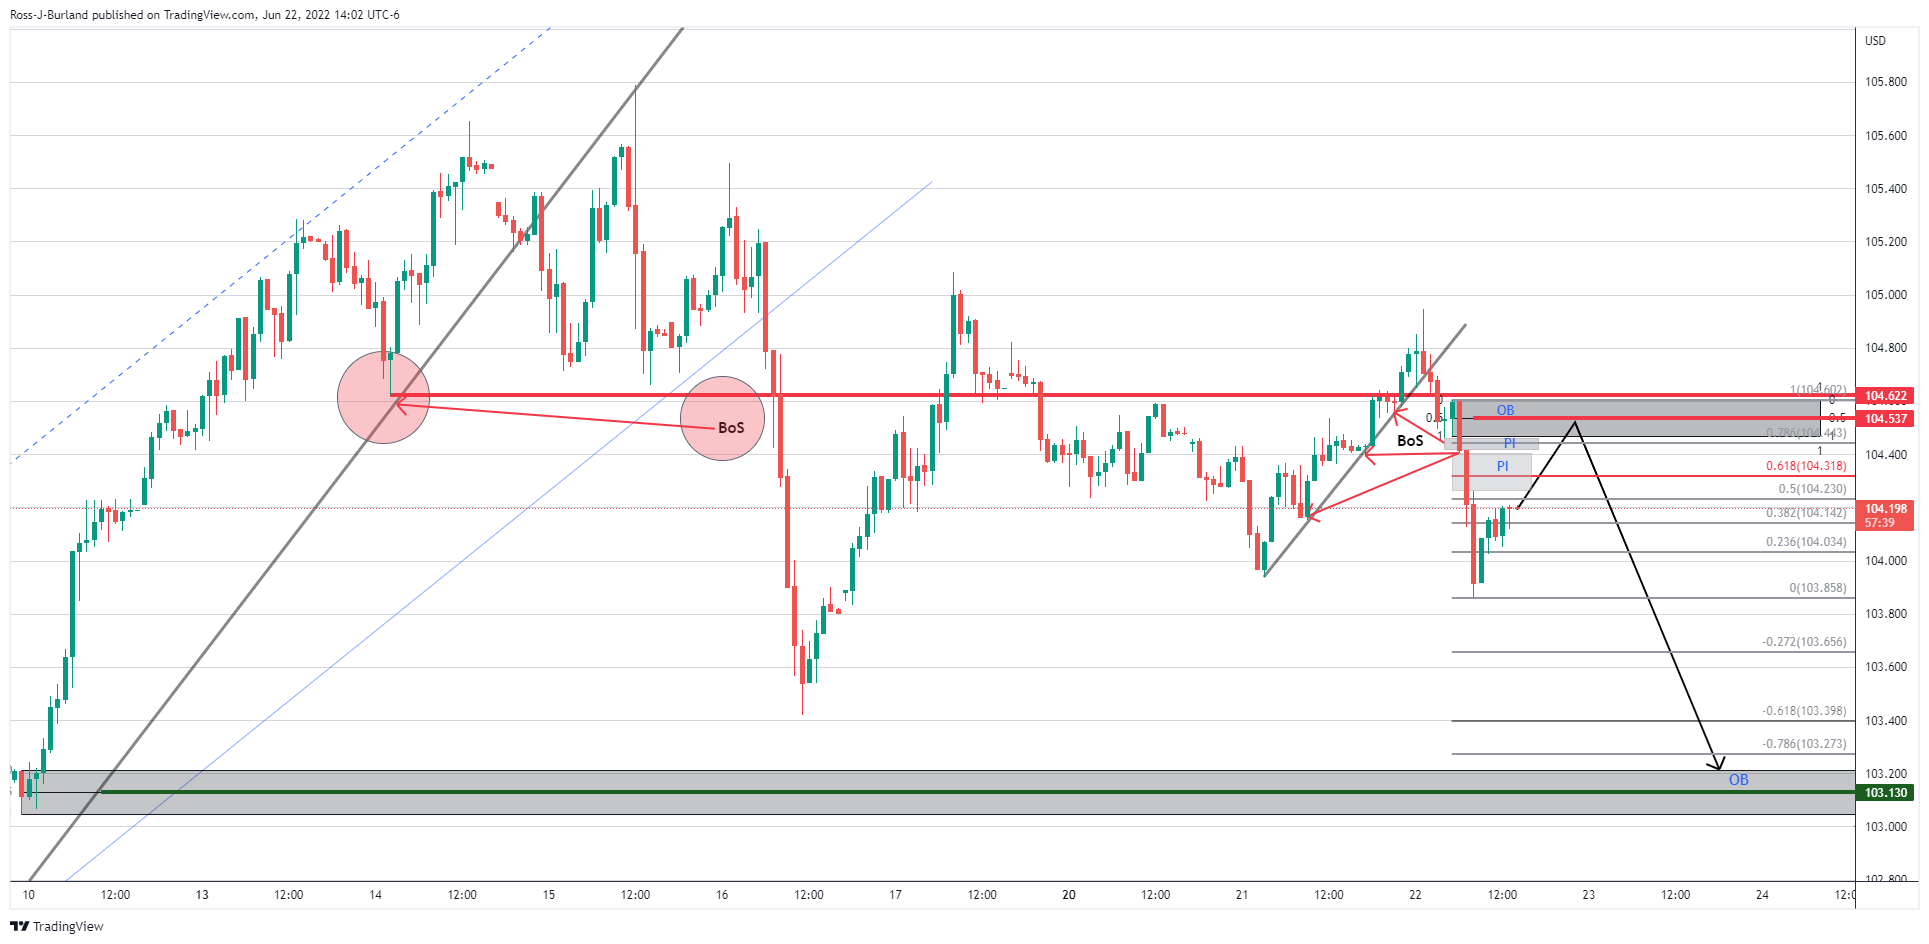
The recent bearish impulse took out a number of short-term higher lows in a break of structures (BoS). Therefore, the downside is to play for. However, there is a price imbalance that could be mitigated prior to a full-on move to the downside.
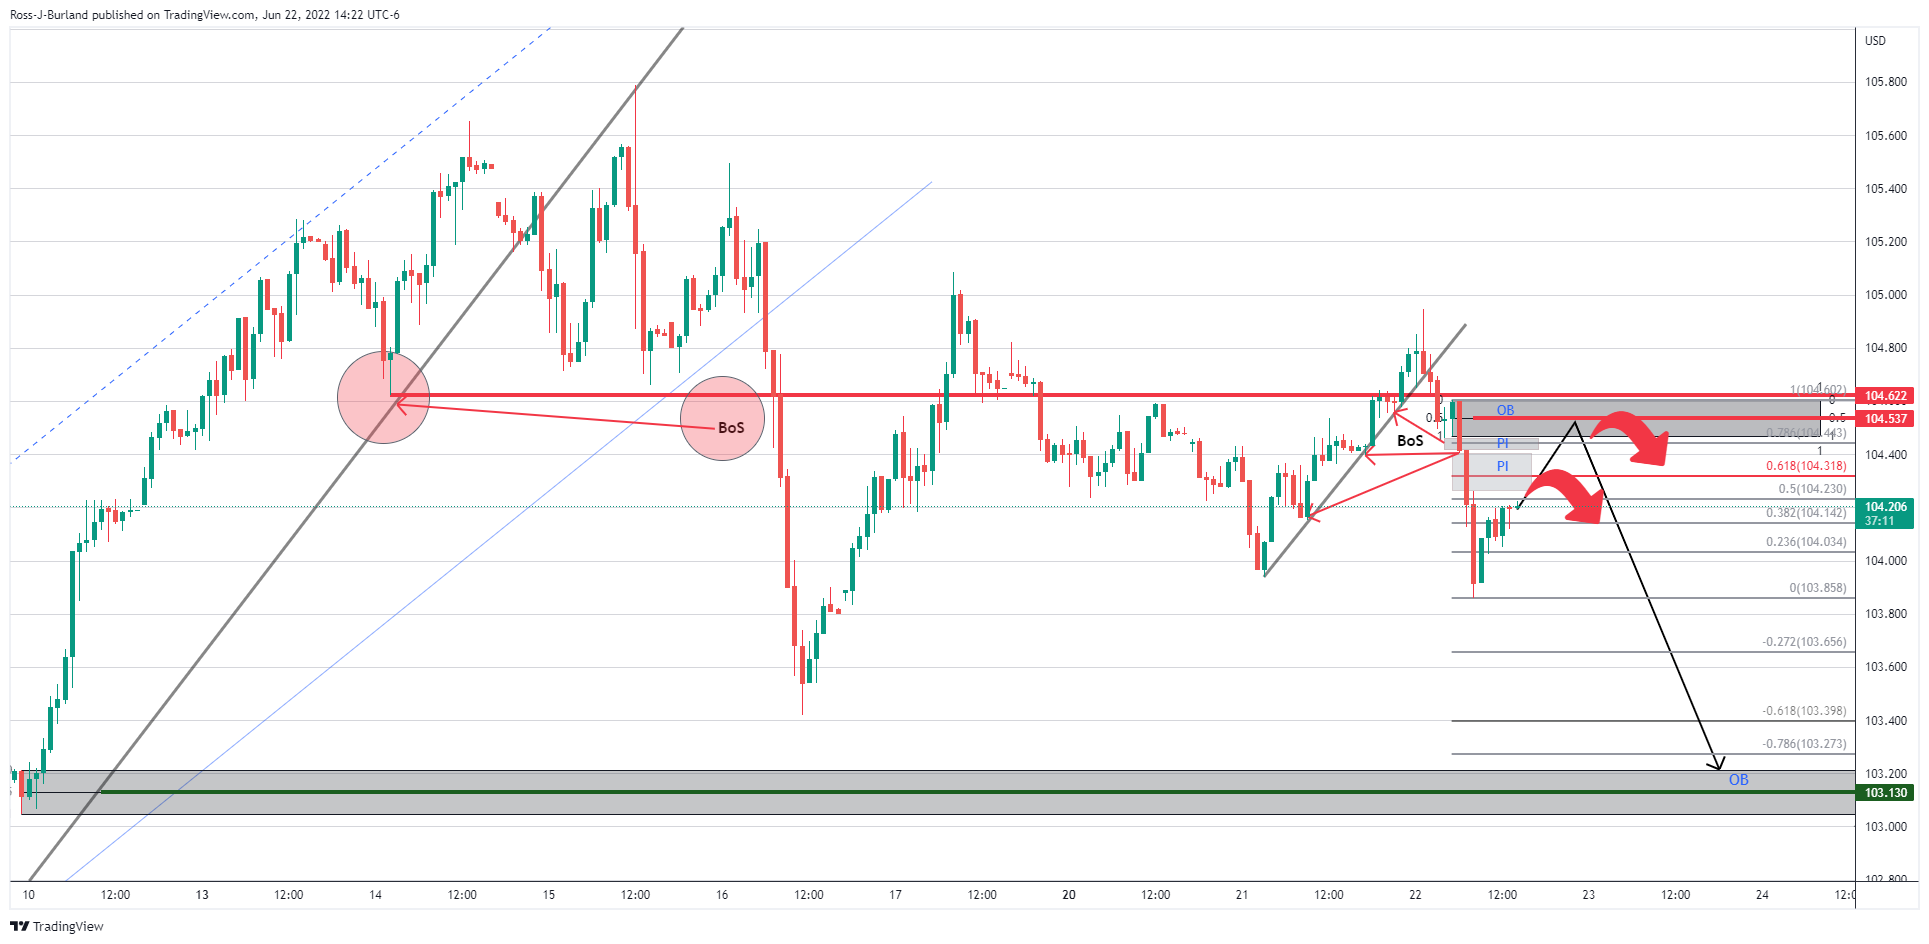
A 61.8% Fibo aligns with the first area of imbalance around 104.32. Thereafter, a restest of a liquidity area or 'order block' (OB) could be the last defence for a move down to the next significant demand area near 103.13, or there about.
DXY daily chart
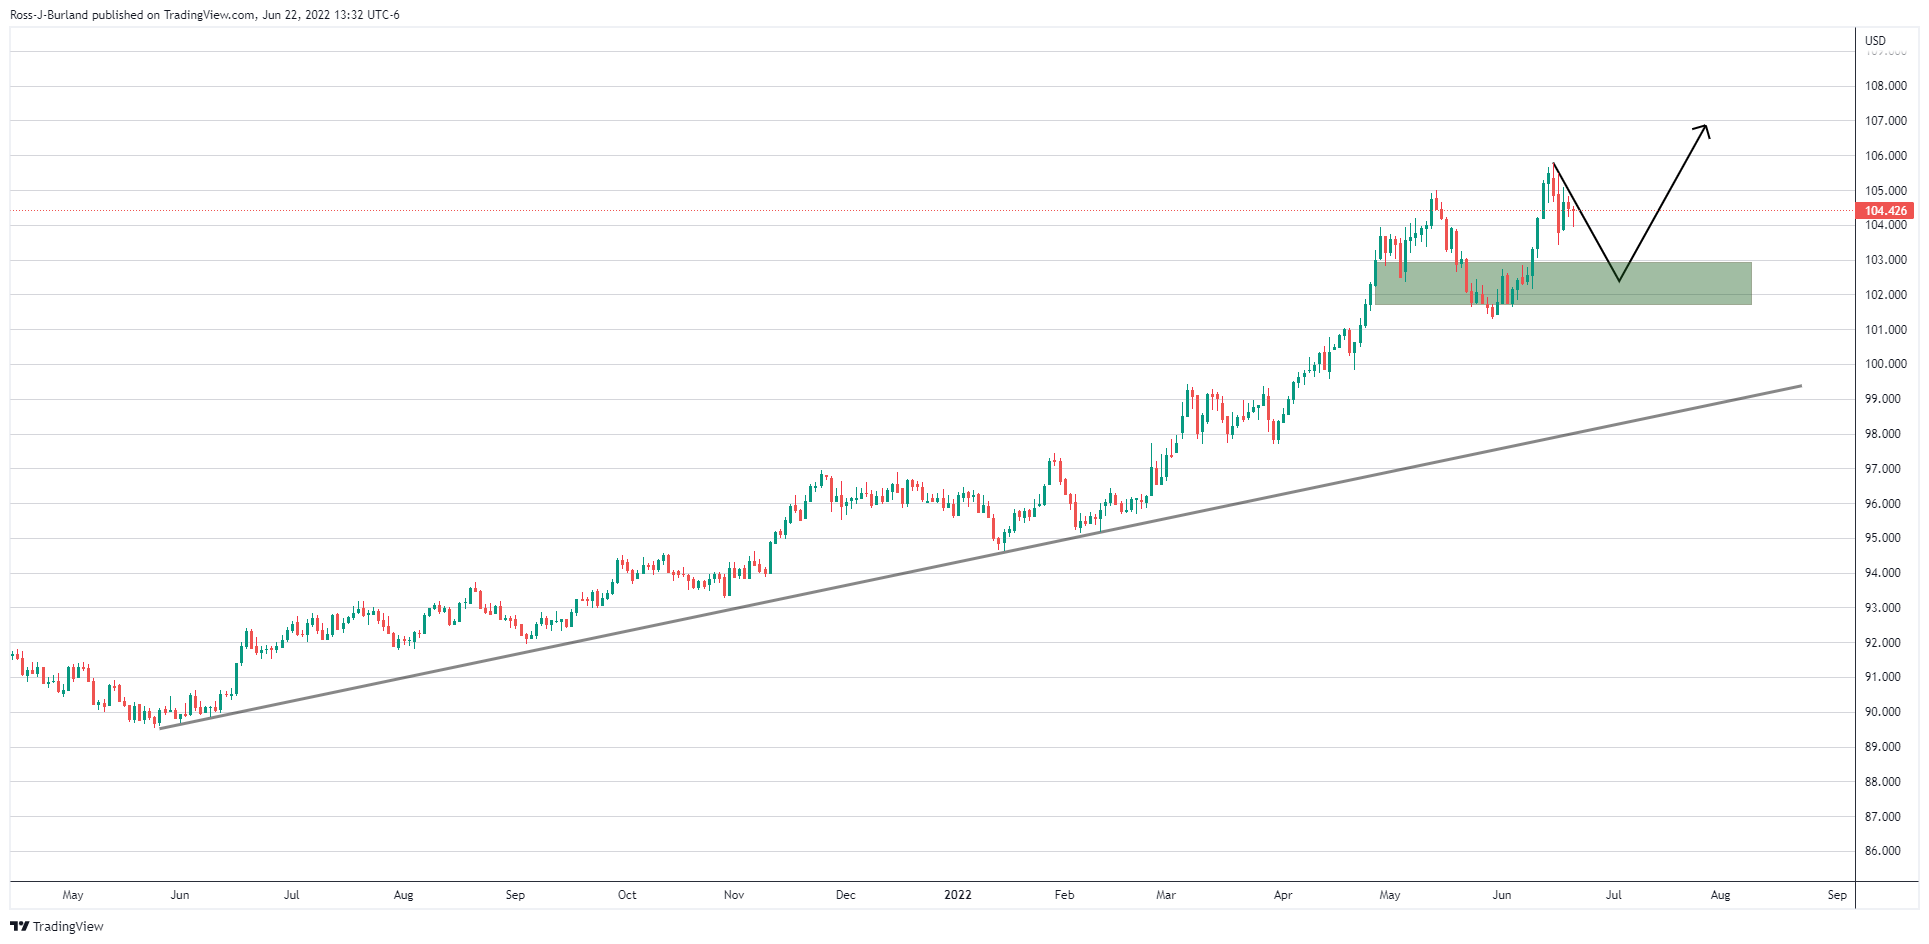
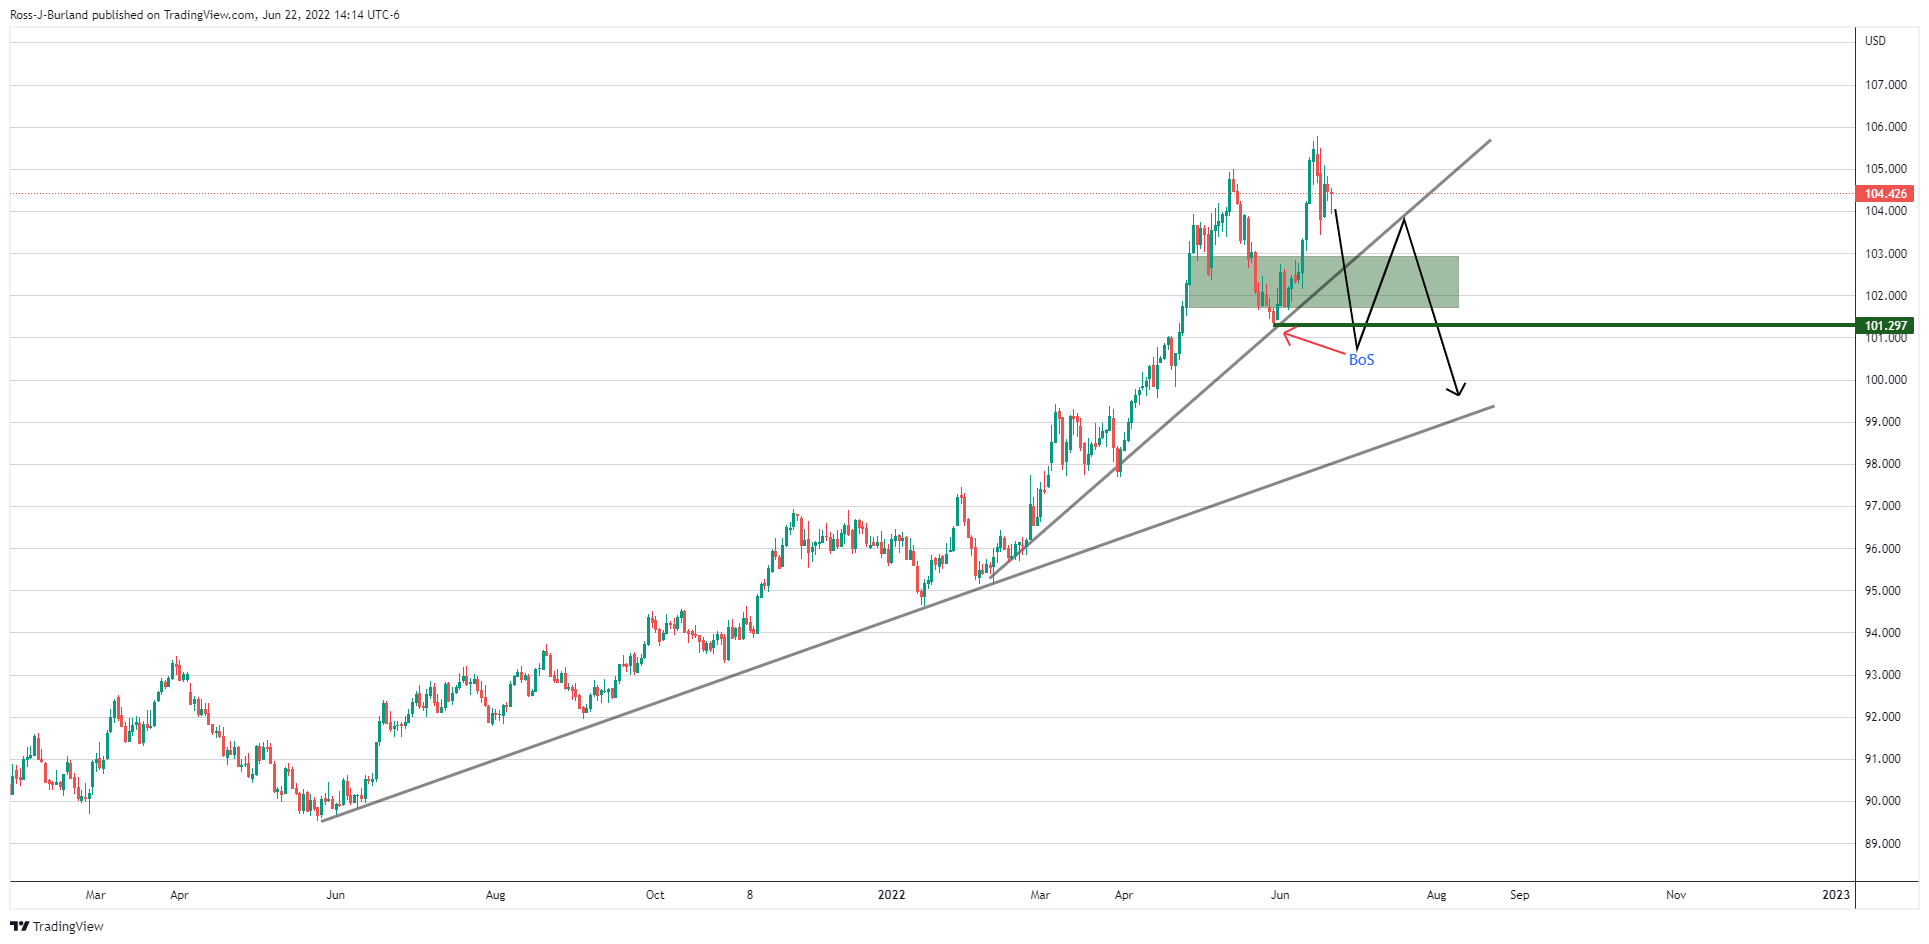
Meanwhile, however, from a daily perspective, the price remains in a bullish uptrend. The market structure is as follows:
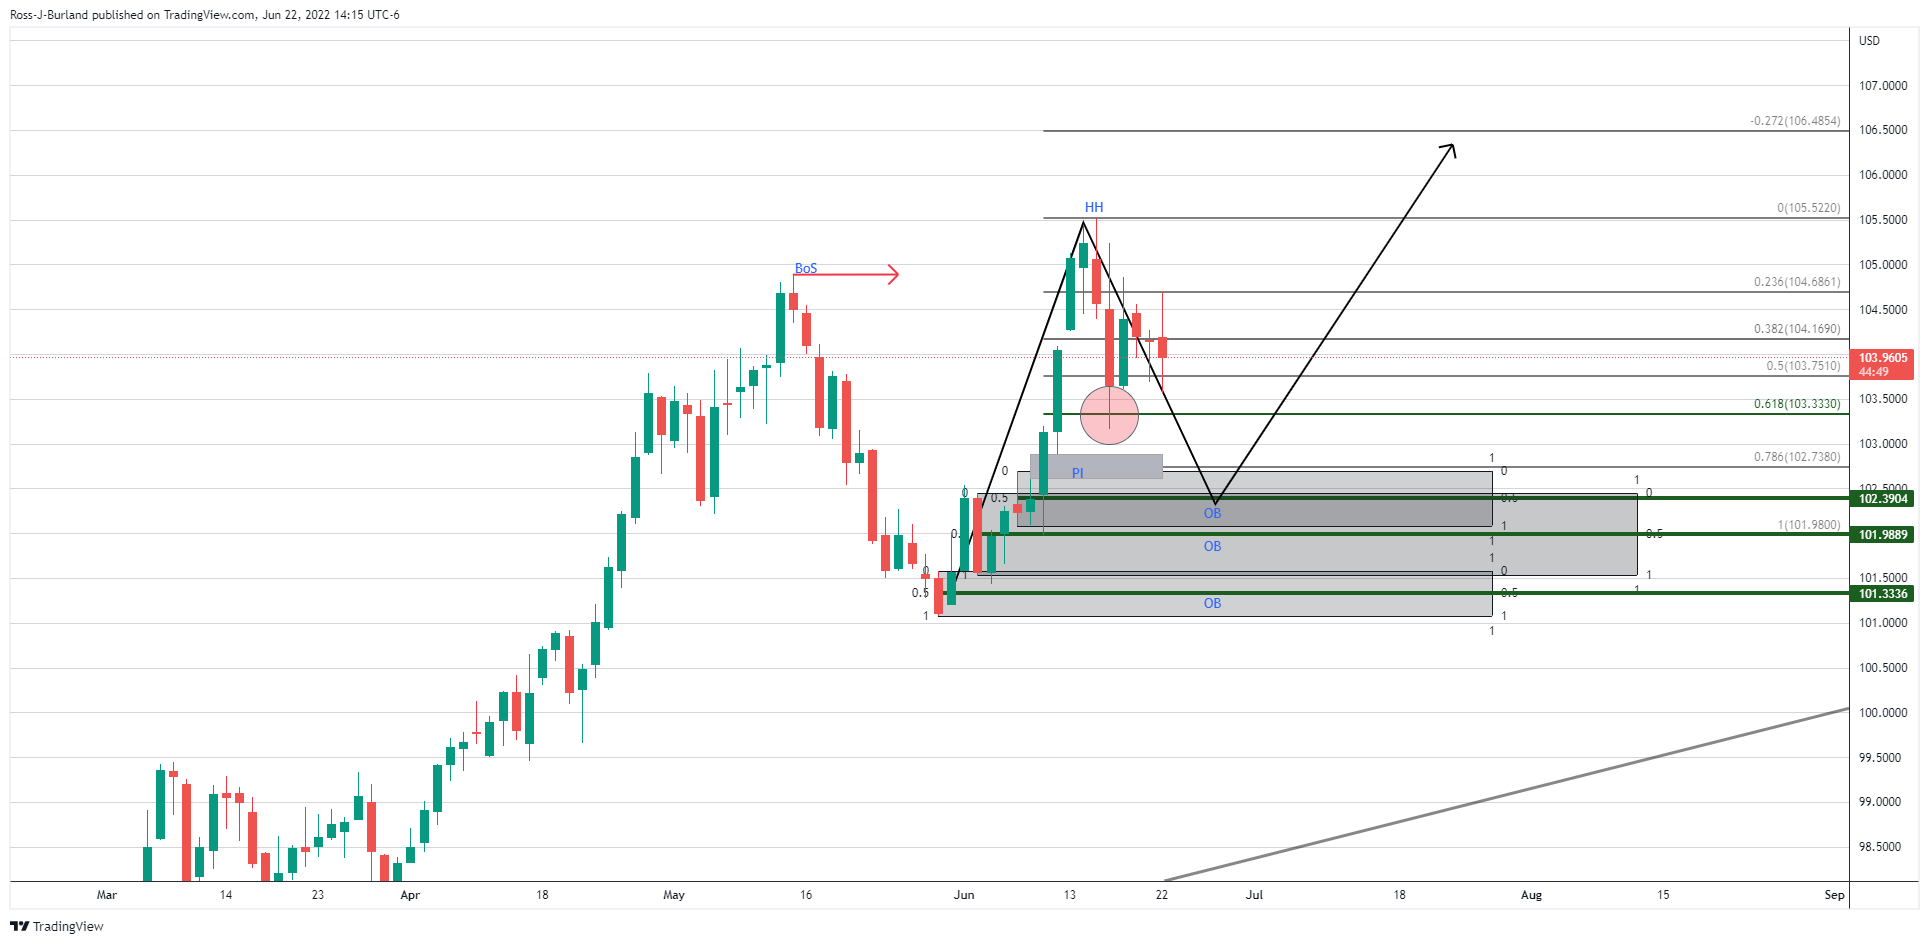
The break of structure led to a higher high. What could be playing out is a mere run on liquidity across the various currencies supporting the index and the US dollar, aka, a healthy correction in the forex market. In the DXY index, there has already been a 61.8% Fibo correction to 103.33 and a touch below where the price rallied.
However, given the breakdown of the short-term market structure, as illustrated above, then this leaves the price imbalance just below 103 vulnerable. Below there, we have a demand area's mid point located at 102.3904, another at 101.9889 and then finally 101.336.
DXY bullish
In any scenario, the bias remains bullish on the daily chart until a break of downside structure, or 101.297, as follows:
Author

Ross J Burland
FXStreet
Ross J Burland, born in England, UK, is a sportsman at heart. He played Rugby and Judo for his county, Kent and the South East of England Rugby team.


