|

NZD/USD Price Analysis: Bears reign supreme, bulls nowhere to be found

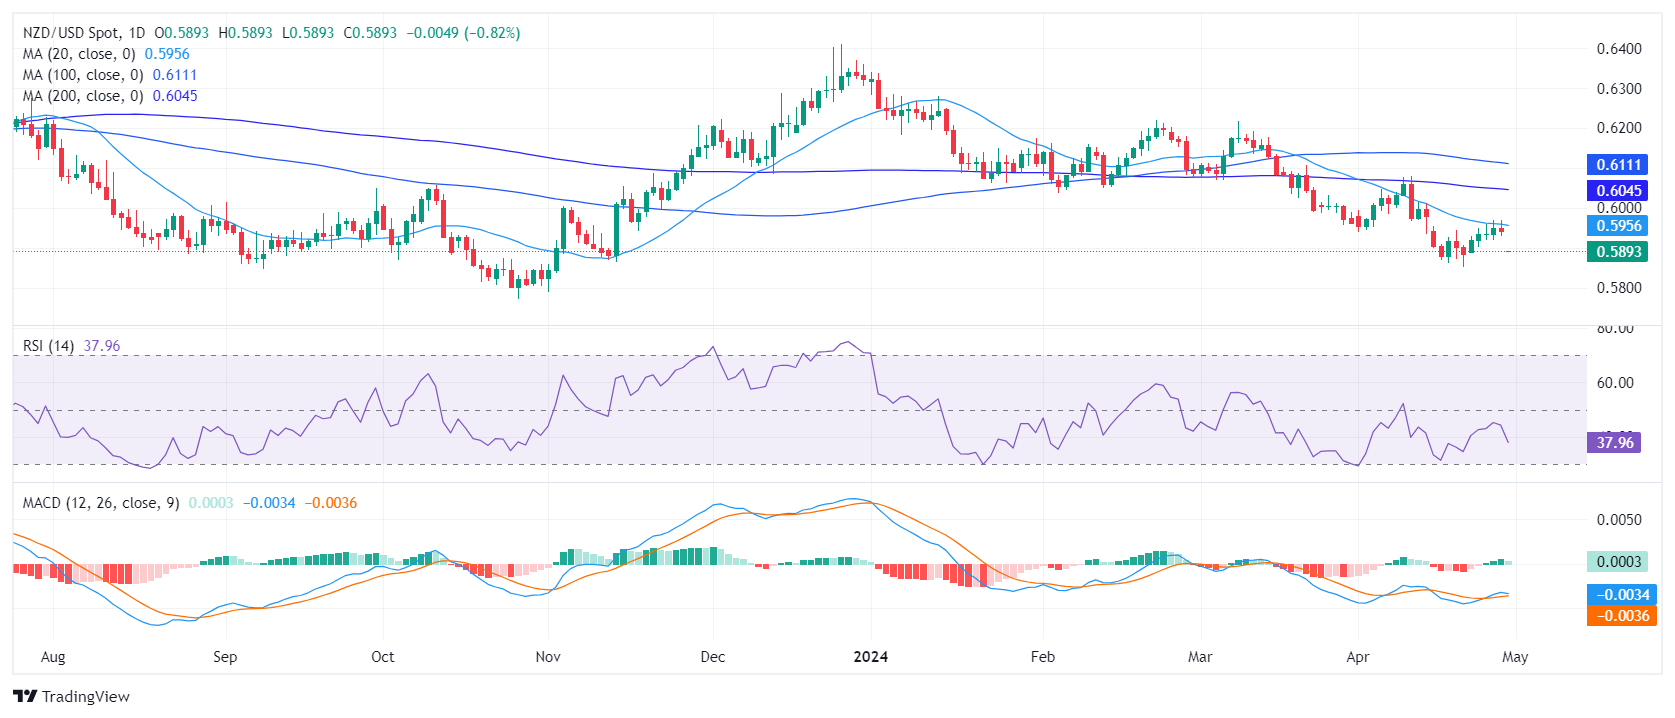
  • The daily indicators of the NZD/USD daily chart confirm a steady bearish momentum.
  • Hourly indicators signal oversold conditions which could lead to a mild upwards correction.
  • The failure to regain the 20-day SMA worsens the outlook of the buyers.

The NZD/USD pair plunged to 0.5890 on Tuesday as bears hit the gas and bulls seem to have given up their momentum gained in the last session. Selling conditions are more extreme in the hourly charts as indicators signal oversold conditions which could lead to an upwards correction in the near tearm.

The daily Relative Strength Index (RSI) for the NZD/USD is in the negative territory. The most recent reading signals sellers are currently dominating the market, with a downward trend. Regarding the Moving Average Convergence Divergence (MACD), the decreasing green bars confirm this bearish momentum with the bullish impulse nowhere to be found.

NZD/USD daily chart

On the hourly chart, the RSI shows stronger oversold conditions in the most recent hours. However, the hourly MACD, indicated by flat red bars on the histogram, shows a flattening bearish momentum. Notably, despite the oversold condition, buyers have not yet stepped in with enough strength to shift the momentum toward the green zone but they might in the next hours.

NZD/USD hourly chart

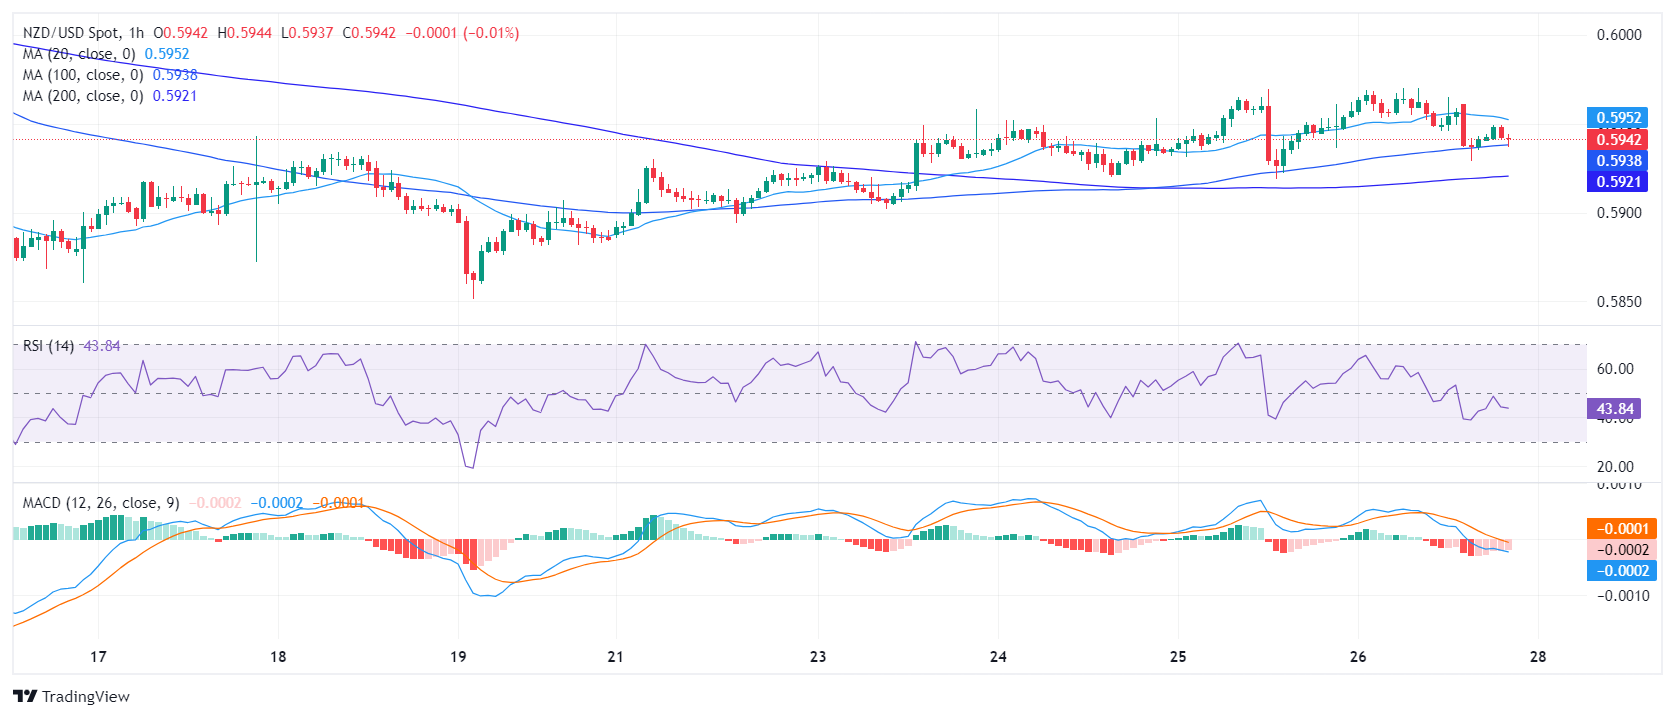
Regarding the larger scope, the NZD/USD displays a bearish trend, evidenced by its position below the Simple Moving Averages (SMA) for the 20, 100, and 200-day periods. After getting rejected by the 20-day SMA multiple times in the last sessions, the outlook is confirmed to be bearish as the time of the buyers seems to be fading. In addition, after failing to conquer that crucial resistance, leaves the pair bound for additional downside. However, ahead of the Asian session, there could be a minor upward correction to consolidate the overextended downward movements seen on the hourly chart.

NZD/USD

Overview
Today last price0.5892
Today Daily Change-0.0084
Today Daily Change %-1.41
Today daily open0.5976
 
Trends
Daily SMA200.596
Daily SMA500.6042
Daily SMA1000.6111
Daily SMA2000.6046
 
Levels
Previous Daily High0.5986
Previous Daily Low0.5941
Previous Weekly High0.597
Previous Weekly Low0.5886
Previous Monthly High0.6218
Previous Monthly Low0.5956
Daily Fibonacci 38.2%0.5969
Daily Fibonacci 61.8%0.5958
Daily Pivot Point S10.5949
Daily Pivot Point S20.5923
Daily Pivot Point S30.5904
Daily Pivot Point R10.5994
Daily Pivot Point R20.6013
Daily Pivot Point R30.6039

Author

Patricio Martín

Patricio is an economist from Argentina passionate about global finance and understanding the daily movements of the markets.

More from Patricio Martín
Share:

Editor's Picks

EUR/USD looks apathetic around 1.1770

EUR/USD comes under renewed pressure on Tuesday, deflating below the 1.1800 support and reversing two consecutive days of gains. The pair’s decline follows the persistent move higher in the US Dollar, as trade uncertainty dominates the sentiment ahead of President Trump’s SOTU speech.

GBP/USD regains 1.3500 and above

GBP/USD extends its advance for the third day in a row on Tuesday, this time retesting the area beyond the 1.3500 hurdle. Cable’s uptick comes despite decent gains in the Greenback and the dovish message from the BoE’s Bailey at the UK Parliament.

Gold appears offered around $5,150

Gold is giving back a good portion of the recent multi-day rally, receding to the $5,150 zone per troy ounce amid the decent bounce in the US Dollar and mixed US Treasuty yields. In the meantime, markets’ attention remain on upcoming comments from Fed speakers.

Ripple’s DeFi shift in focus: Navigating XRPL EVM sidechain growth, XRPFi migration and liquidity

Ripple (XRP) has continued to trade under pressure, extending its decline by approximately 63% from the record high of $3.66 in July. The remittance token is trading above support at $1.35, while its upside appears limited by key supply zones, starting with $1.40, at the time of writing on Tuesday.

The Citrini report: How a debatable AI narrative can shake Wall Street

That AI-related headline alone was enough to rattle investors.US stocks slid sharply on Monday after a widely circulated Citrini Research memo outlined a hypothetical “2028 Global Intelligence Crisis”, warning that rapid AI adoption could push US unemployment into double digits as early as by mid-2028.

XRP pressured by weak ETF flows and declining retail interest

Ripple (XRP) is edging lower, trading above its intraday low of $1.32 at the time of writing on Tuesday. The decline from its weekly opening of $1.39 reflects heightened volatility in the broader cryptocurrency market, accentuated by tariff-triggered uncertainty.