NZD/USD Price Analysis: Bears maintain control, upwards correction signals emerge


  • The daily RSI reveals a negative trend for NZD/USD, suggesting prevalent selling pressure.
  • As the RSI stands near oversold conditions, the daily chart hints at a potential consolidation in the next sessions.
  • Indicators on the hourly chart corroborate the selling bias, while subtly highlighting signs of imminent recovery.

The NZD/USD pair is currently trading at around 0.5903, suggesting a stronghold of the sellers in the market. The pair's tendency to trade below the short-term Simple Moving Averages (SMAs) indicates a short-term bearish outlook. However, with the oversold conditions looming, a possible reversal may not be too far off.

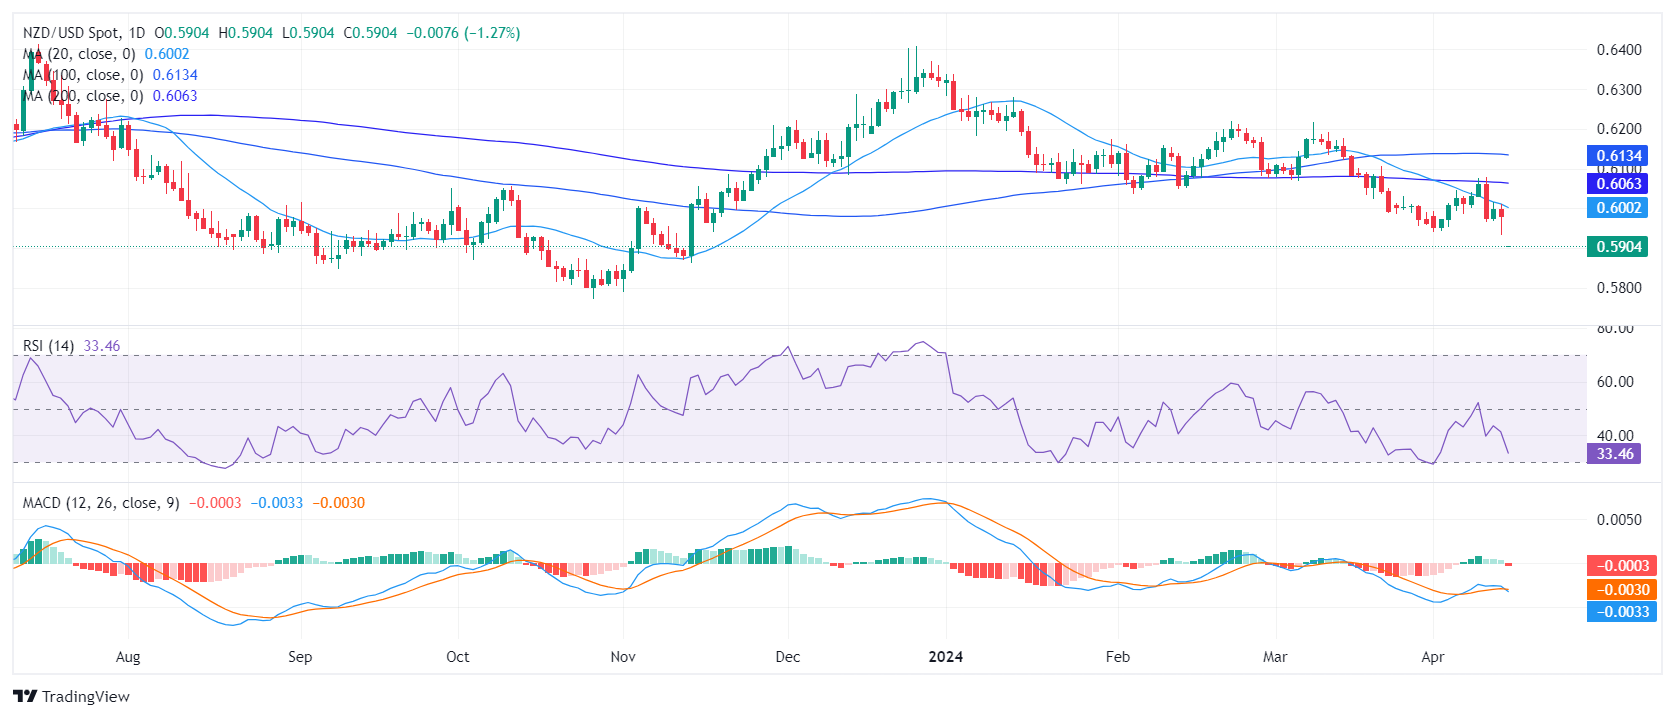
On the daily chart, the Relative Strength Index (RSI) readings have remained under a negative trend with the RSI sitting at 35, indicating a nearing oversold condition. This suggests that sellers have dominated the market in recent sessions. The negative momentum is also represented by the fresh red bar of the Moving Average Convergence Divergence (MACD), suggesting a current bearish bias. However, the nearing oversold condition signals the possibility of a trend reversal.

NZD/USD daily chart

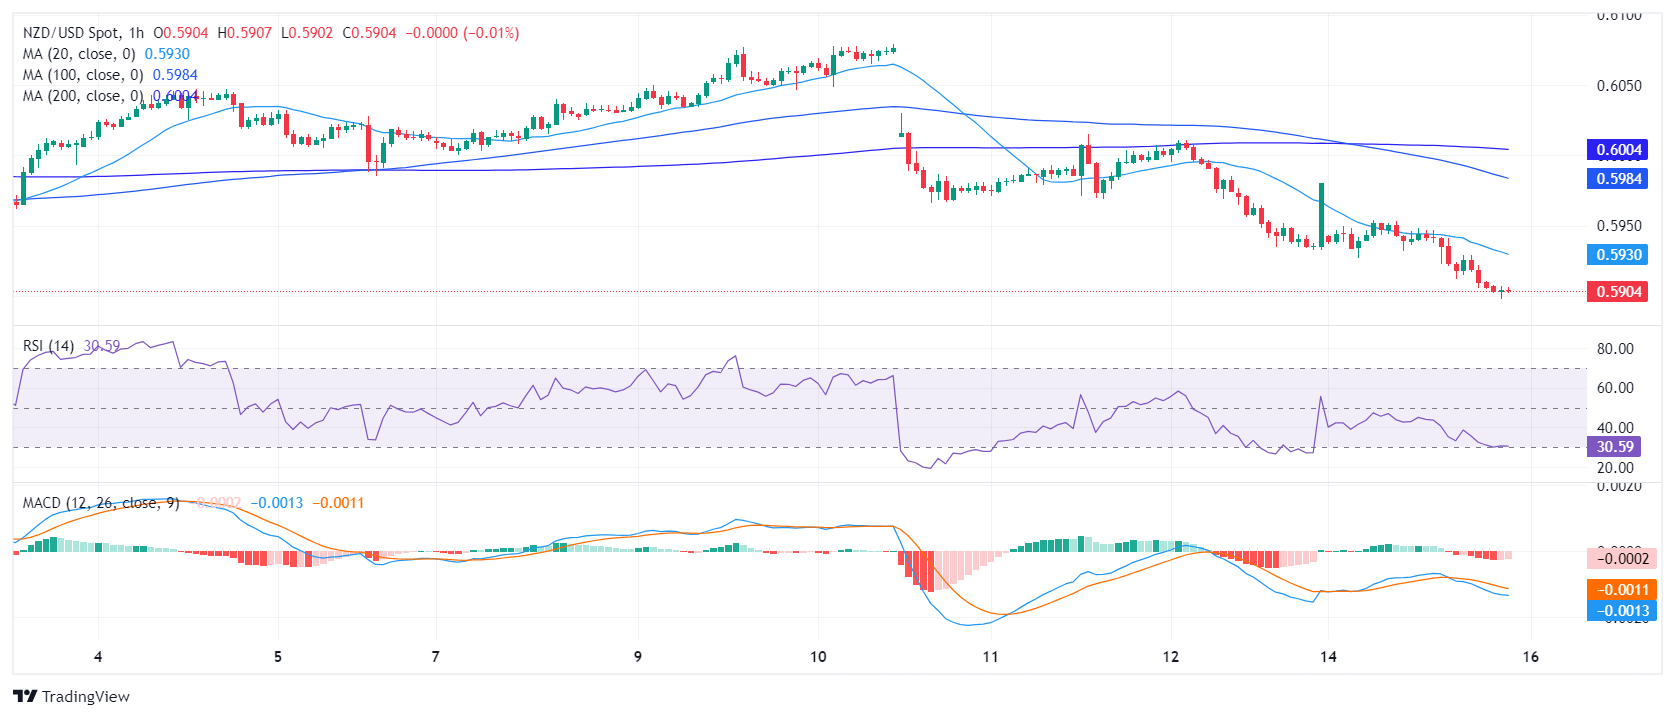
Comparing this to the hourly chart, it is observed that the RSI values are still in the negative range and dangerously near the oversold threshold. The MACD histogram presents a flat red bar, indicating negative momentum, and essentially reaffirms the conclusion drawn from the daily charts, that the market has a prevalent selling bias, but there are signs of potential recovery.

NZD/USD hourly chart

Inspecting the broader outlook, the NZD/USD shows a negative outlook as it sits below its 20,100 and 200-day Simple Moving Average (SMA).

In conclusion, both the daily and the hourly technical outlooks suggest a bearish bias for the NZD/USD pair. However, traders should remain cautious of potential reversals given the nearing oversold condition based on the RSI readings.

NZD/USD

Overview
Today last price 0.5905
Today Daily Change -0.0075
Today Daily Change % -1.25
Today daily open 0.598
 
Trends
Daily SMA20 0.6011
Daily SMA50 0.6082
Daily SMA100 0.6136
Daily SMA200 0.6065
 
Levels
Previous Daily High 0.6011
Previous Daily Low 0.5933
Previous Weekly High 0.6079
Previous Weekly Low 0.5933
Previous Monthly High 0.6218
Previous Monthly Low 0.5956
Daily Fibonacci 38.2% 0.5963
Daily Fibonacci 61.8% 0.5981
Daily Pivot Point S1 0.5938
Daily Pivot Point S2 0.5897
Daily Pivot Point S3 0.586
Daily Pivot Point R1 0.6016
Daily Pivot Point R2 0.6053
Daily Pivot Point R3 0.6094


Share: Feed news

Information on these pages contains forward-looking statements that involve risks and uncertainties. Markets and instruments profiled on this page are for informational purposes only and should not in any way come across as a recommendation to buy or sell in these assets. You should do your own thorough research before making any investment decisions. FXStreet does not in any way guarantee that this information is free from mistakes, errors, or material misstatements. It also does not guarantee that this information is of a timely nature. Investing in Open Markets involves a great deal of risk, including the loss of all or a portion of your investment, as well as emotional distress. All risks, losses and costs associated with investing, including total loss of principal, are your responsibility. The views and opinions expressed in this article are those of the authors and do not necessarily reflect the official policy or position of FXStreet nor its advertisers. The author will not be held responsible for information that is found at the end of links posted on this page.

If not otherwise explicitly mentioned in the body of the article, at the time of writing, the author has no position in any stock mentioned in this article and no business relationship with any company mentioned. The author has not received compensation for writing this article, other than from FXStreet.

FXStreet and the author do not provide personalized recommendations. The author makes no representations as to the accuracy, completeness, or suitability of this information. FXStreet and the author will not be liable for any errors, omissions or any losses, injuries or damages arising from this information and its display or use. Errors and omissions excepted.

The author and FXStreet are not registered investment advisors and nothing in this article is intended to be investment advice.

Recommended content


Recommended content

Editors’ Picks

AUD/USD retargets the 0.6600 barrier and above

AUD/USD retargets the 0.6600 barrier and above

AUD/USD extended its positive streak for the sixth session in a row at the beginning of the week, managing to retest the transitory 100-day SMA near 0.6580 on the back of the solid performance of the commodity complex.

AUD/USD News

EUR/USD keeps the bullish bias above 1.0700

EUR/USD keeps the bullish bias above 1.0700

EUR/USD rapidly set aside Friday’s decline and regained strong upside traction in response to the marked retracement in the Greenback following the still-unconfirmed FX intervention by the Japanese MoF.

EUR/USD News

Gold advances for a third consecutive day

Gold advances for a third consecutive day

Gold fluctuates in a relatively tight channel above $2,330 on Monday. The benchmark 10-year US Treasury bond yield corrects lower and helps XAU/USD limit its losses ahead of this week's key Fed policy meeting.

Gold News

Bitcoin price dips to $62K range despite growing international BTC validation via spot ETFs

Bitcoin price dips to $62K range despite growing international BTC validation via spot ETFs

Bitcoin (BTC) price closed down for four weeks in a row, based on the weekly chart, and could be on track for another red candle this week. The last time it did this was in the middle of the bear market when it fell by 42% within a span of nine weeks. 

Read more

Japan intervention: Will it work?

Japan intervention: Will it work?

Dear Japan Intervenes in the Yen for the first time since November 2022 Will it work? Have we seen a top in USDJPY? Let's go through the charts.

Read more

Forex MAJORS

Cryptocurrencies

Signatures