- The NZD/USD maintains a bearish stance while showing a flattening buying momentum on both daily and hourly charts.
- The bulls got rejected again by the 20-day SMA.
- Any upward movement that fails to conquer the mentioned SMA shouldn’t be considered a buying signal.
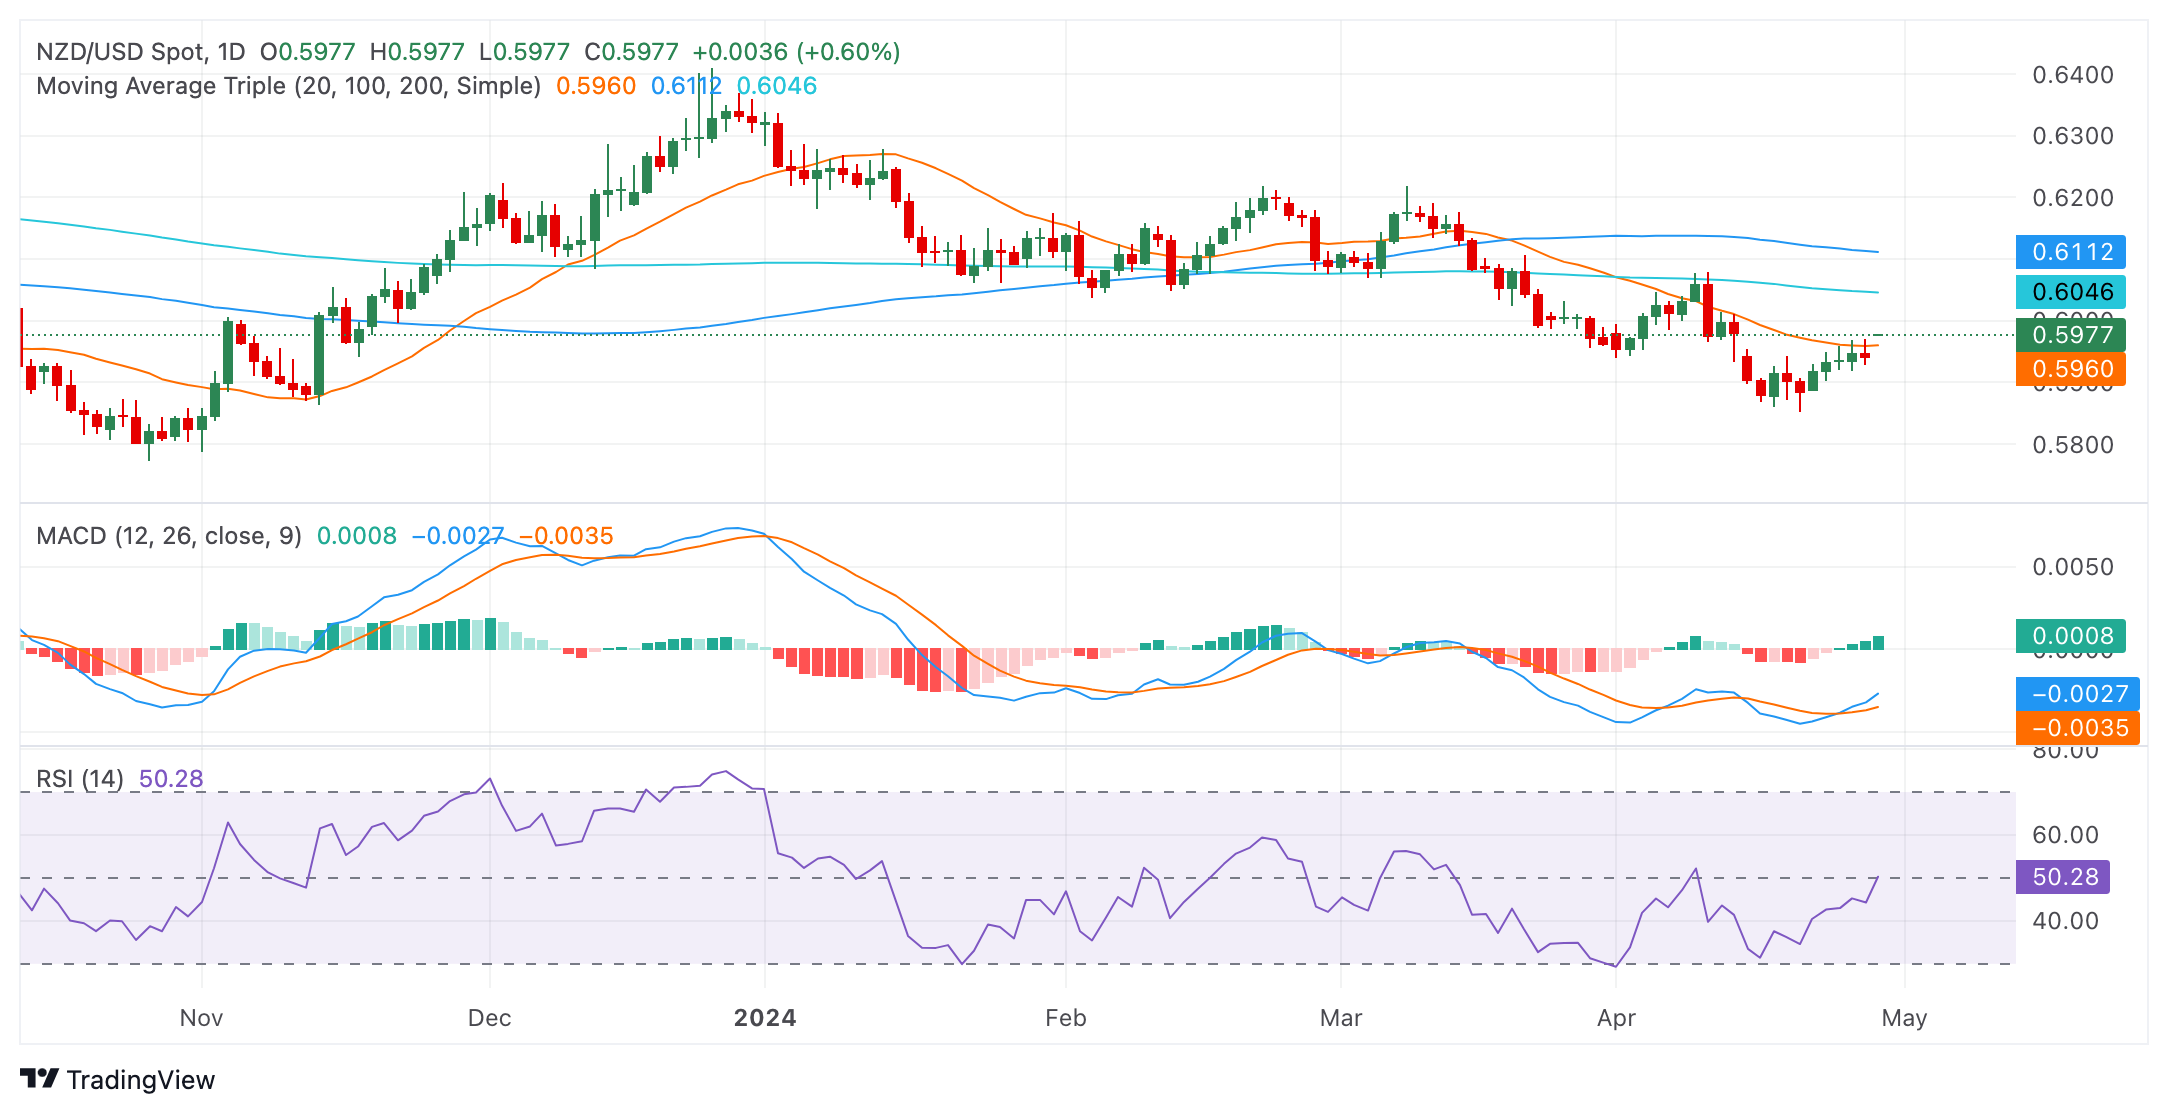
The NZD/USD pair rallied to 0.5980 on Monday and then stabilized around 0.5960, yet maintains a bearish outlook. While recent movements have shown increased buying momentum, significant positioning beneath key Simple Moving Averages (SMAs) indicates a larger bearish bias and as long as the pair is kept below this levels, the outlook will remain in favor of the bears.
On the daily chart, the Relative Strength Index (RSI) indicates a positive trend for the NZD/USD pair. From the oversold territory, the index is now on its way to its middle point, demonstrating an increase in buying momentum. The Moving Average Convergence Divergence (MACD) histogram displays flat green bars, suggesting steady positive momentum with buyers dominating the market but warns of a flattening buying traction.
NZD/USD daily chart
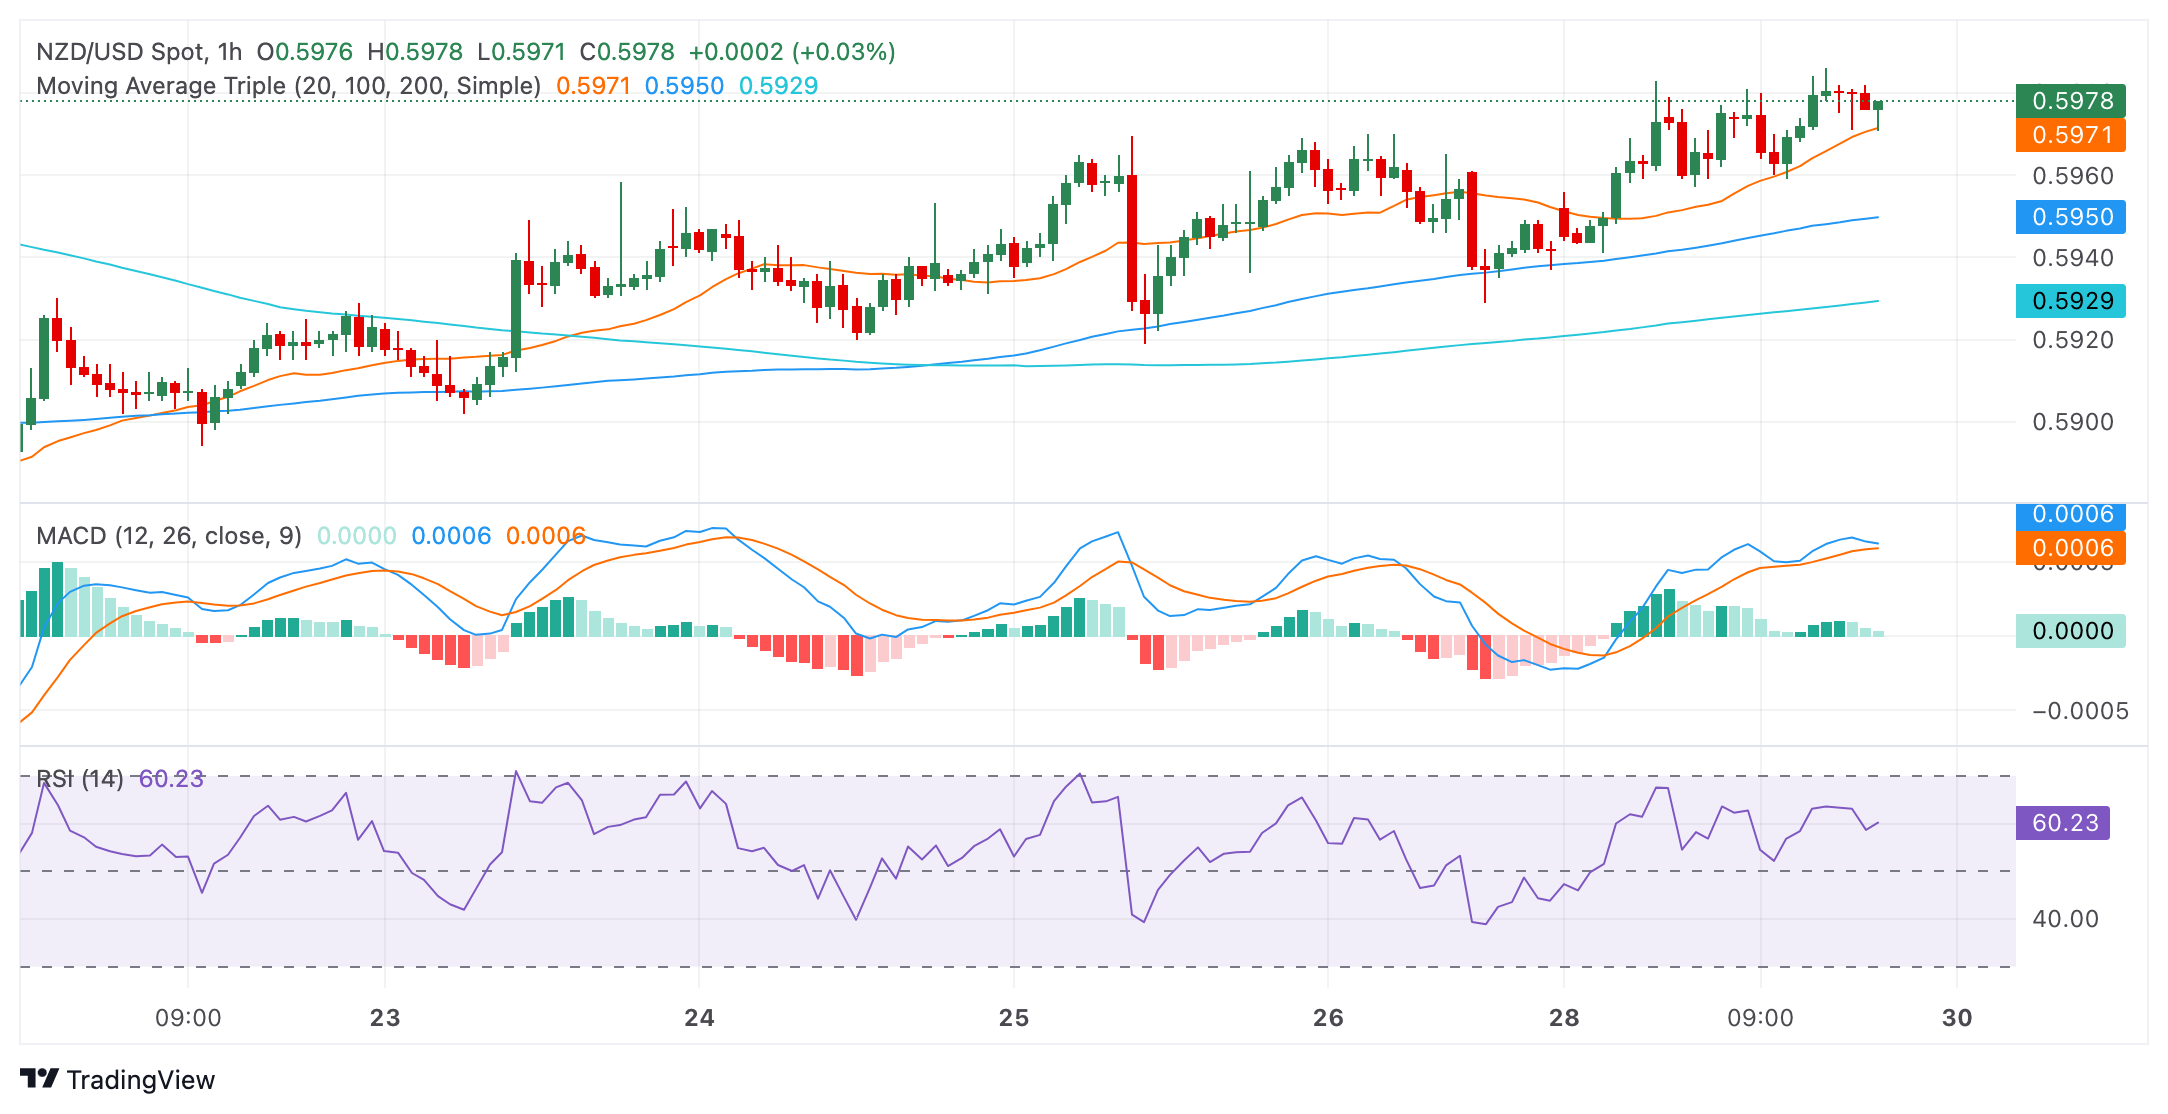
Transitioning to the hourly chart, the RSI maintains a positive outlook, hovering around the 57 mark but is currently pointing down, suggesting that the buyers are running out of steam in this timeframe. The MACD shows flat green bars, pointing to a more cautious uptrend.
NZD/USD hourly chart
While analyzing the broader scope, the pair currently sits in a bearish posture. The Kiwi's position below its 20, 100, and 200-day Simple Moving Average (SMA), indicates an overall downtrend. The 20-day SMA rejected the buyers at the 0.596 mark on Monday, which could discourage bullish traders. However, ahead of the Asian session, buyers might make an additional stride to recover that level which could brighten the outlook for the pair.
Information on these pages contains forward-looking statements that involve risks and uncertainties. Markets and instruments profiled on this page are for informational purposes only and should not in any way come across as a recommendation to buy or sell in these assets. You should do your own thorough research before making any investment decisions. FXStreet does not in any way guarantee that this information is free from mistakes, errors, or material misstatements. It also does not guarantee that this information is of a timely nature. Investing in Open Markets involves a great deal of risk, including the loss of all or a portion of your investment, as well as emotional distress. All risks, losses and costs associated with investing, including total loss of principal, are your responsibility. The views and opinions expressed in this article are those of the authors and do not necessarily reflect the official policy or position of FXStreet nor its advertisers. The author will not be held responsible for information that is found at the end of links posted on this page.
If not otherwise explicitly mentioned in the body of the article, at the time of writing, the author has no position in any stock mentioned in this article and no business relationship with any company mentioned. The author has not received compensation for writing this article, other than from FXStreet.
FXStreet and the author do not provide personalized recommendations. The author makes no representations as to the accuracy, completeness, or suitability of this information. FXStreet and the author will not be liable for any errors, omissions or any losses, injuries or damages arising from this information and its display or use. Errors and omissions excepted.
The author and FXStreet are not registered investment advisors and nothing in this article is intended to be investment advice.
Recommended content
Editors’ Picks
AUD/USD on the backfoot, slides below 0.6700

The Australian Dollar registered losses of 0.37% against the US Dollar on Monday, amid rising US Treasury yields that underpinned the Greenback. An upbeat market sentiment could not boost the high-beta Aussie Dollar, which tumbled below the 0.6700 figure. As the Asian session begins, the AUD/USD trades around 0.6668.
EUR/USD eased from 1.0880 on Monday as looming rate differential weighs

EUR/USD eased back from 1.0880 on Monday as talking points from Fed officials weighed on otherwise quiet market flows. Broader markets are keenly anxious for signs of a rate cut from the Fed, but central planners continue to force down expectations with a tricky inflation outlook hobbling the Fed’s options on rate moves.
Gold price retreats after hitting record high at $2,450

Gold price extended its gains on Monday, yet it trades slightly below the all-time high of $2,450 reached during the Asian session amid increasing expectations that major central banks, including the Federal Reserve, might ease policy during 2024.
Digital asset weekly inflows jump over 600% following response to CPI report

Coinshares weekly report of digital asset flows shows that crypto assets witnessed more than a 600% increase in net inflows last week after US Consumer Price Index saw a softer-than-expected inflation increase.
Signed into law: Alabama abolishes income taxes on Gold and Silver

On May 14, 2024, Alabama Governor Kay Ivey signed a bill that removes all income taxes on capital gains from the sale of gold and silver, enabling the state to take an important step forward in reinforcing sound money principles.