|

NZD/USD Price Analysis: Bearish pattern unfolding

  • NZD/USD is declining in the final C leg of a bearish pattern. 
  • The Measured Move is likely to fall to a target in the 0.5800s. 
  • The RSI is oversold on the daily chart suggesting a risk of a pullback. 

NZD/USD is falling in a bearish three-wave pattern, known as a Measured Move. This type of pattern consists of three waves, usually labeled ABC, in which wave A and C are commonly of the same length – or related by a Fibonacci ratio. 

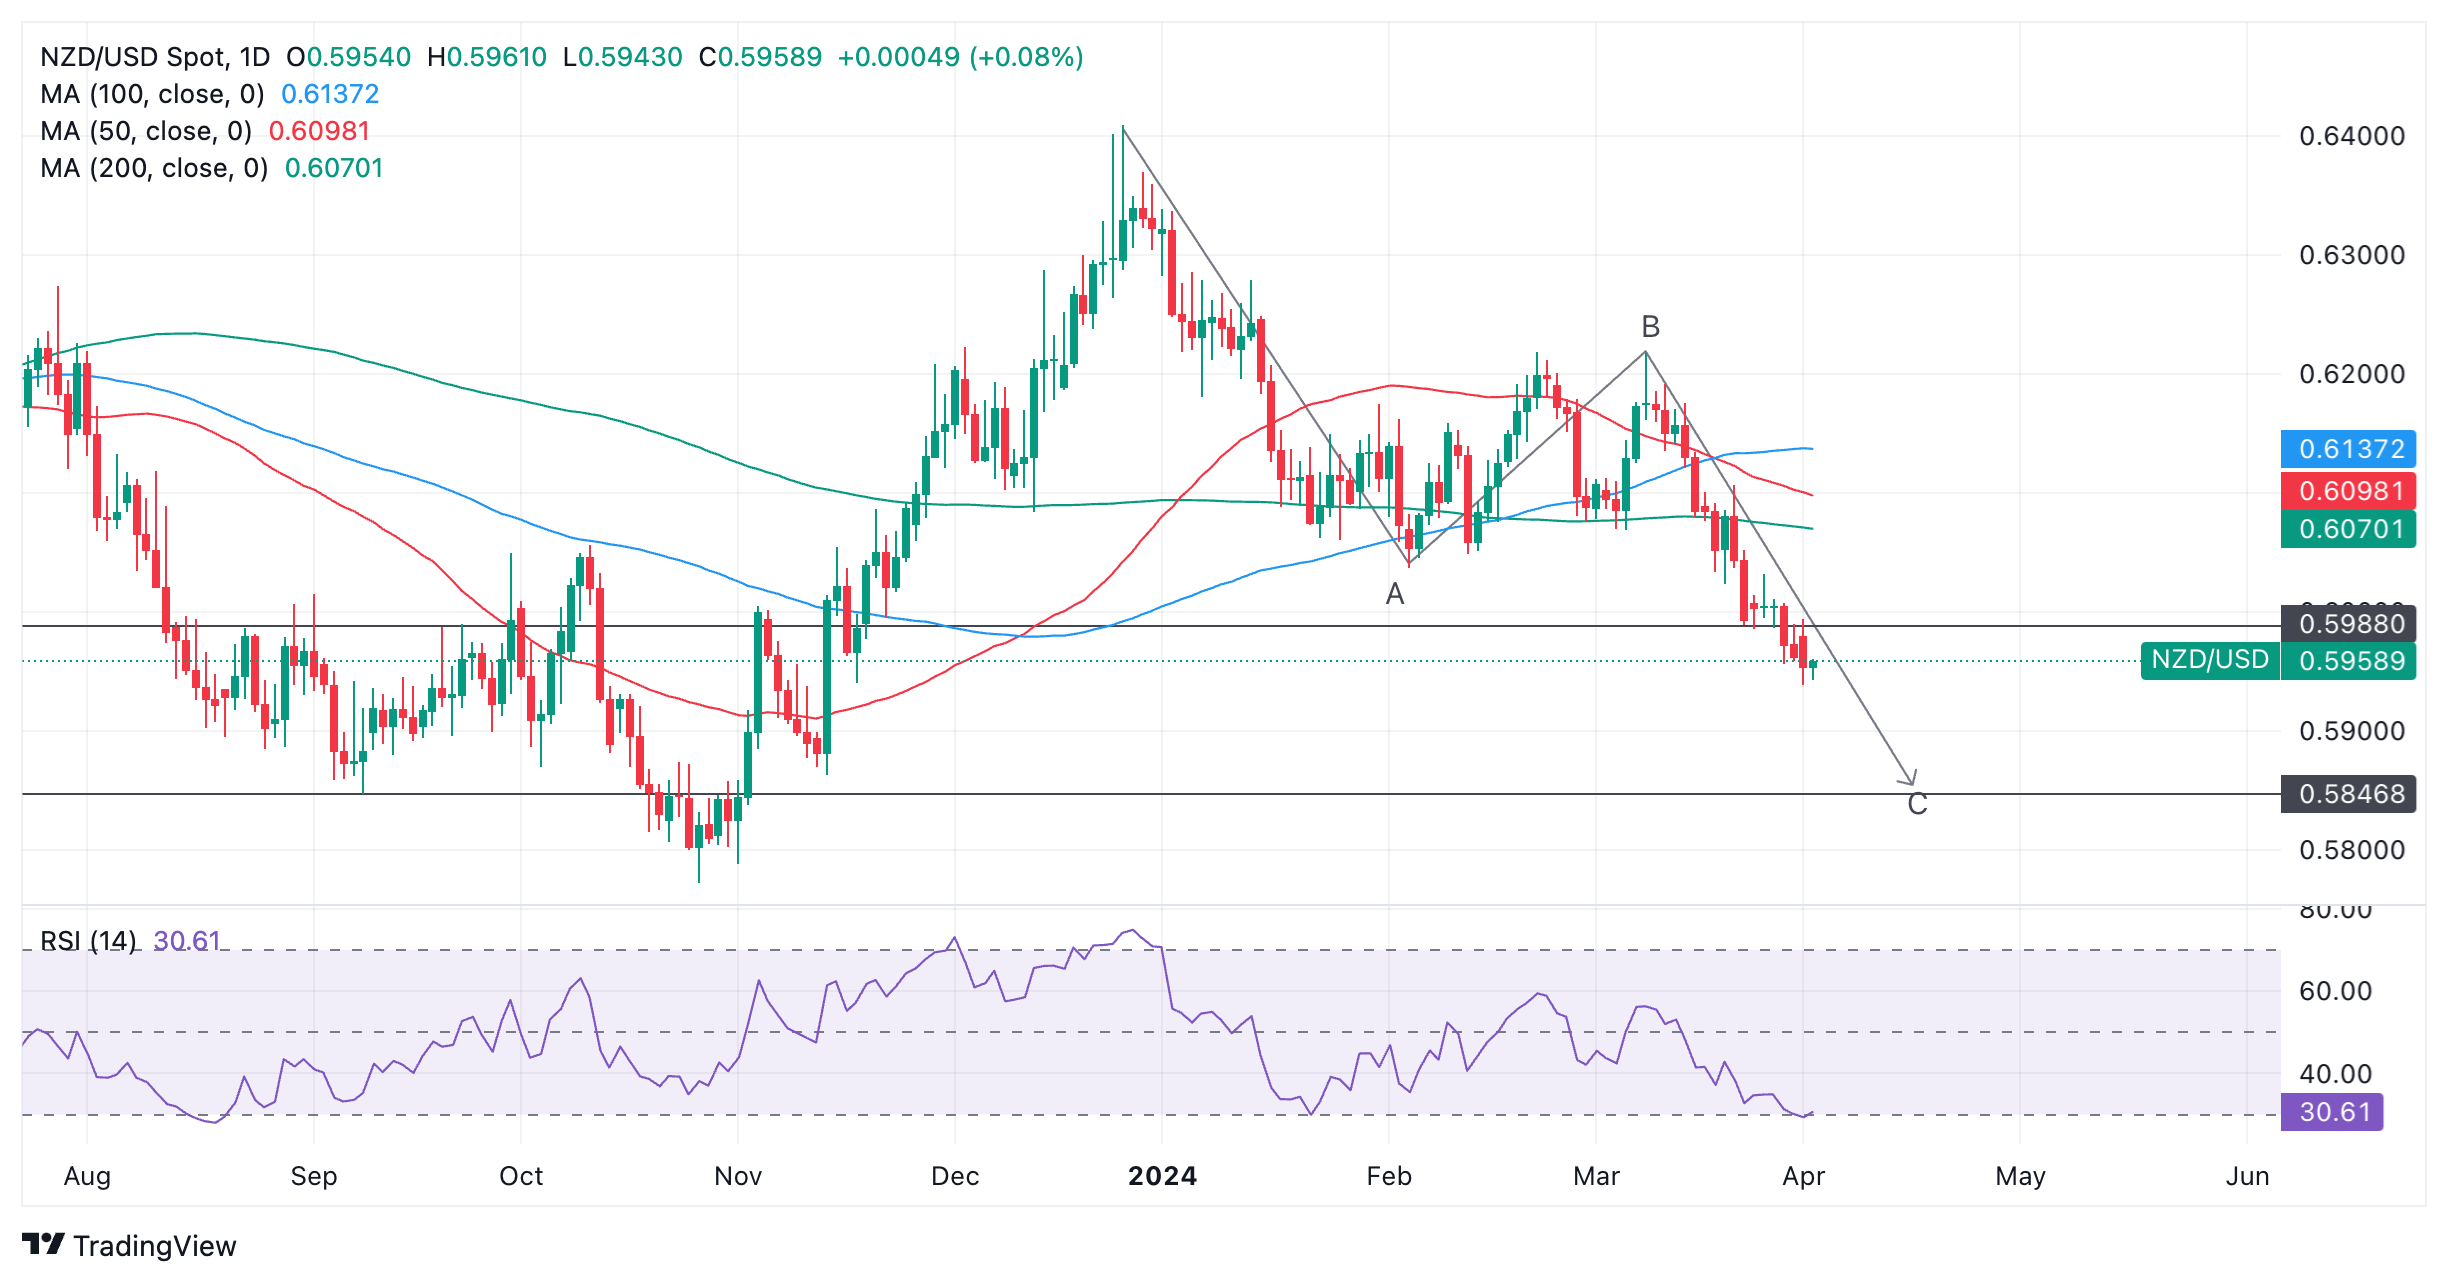
 New Zealand Dollar versus US Dollar: Daily chart

Assuming the pattern unfolds as expected, NZD/USD is likely to fall to a target at roughly 0.5847, corresponding to the end of wave C. 

NZD/USD has already broken below the conservative target for the pattern at 0.5988, measured as wave C being equal to a 0.618 Fibonacci ratio of wave A. 

The pair is in a short-term downtrend which, according to the adage that “the trend is your friend,” is likely to continue. 

The Relative Strength Index (RSI) momentum indicator, fixed at 29.32 on Monday’s close, is oversold which means there is now a risk of a pullback occurring. 

If the RSI exits oversold it will signal the price will probably rise and traders should close their short bets and open longs. 

If the RSI remains below 30 in the oversold zone it will signal traders should keep their short bets open but not add to them.

Author

Joaquin Monfort

Joaquin Monfort is a financial writer and analyst with over 10 years experience writing about financial markets and alt data. He holds a degree in Anthropology from London University and a Diploma in Technical analysis.

More from Joaquin Monfort
Share:

Markets move fast. We move first.

Orange Juice Newsletter brings you expert driven insights - not headlines. Every day on your inbox.

By subscribing you agree to our Terms and conditions.

Editor's Picks

EUR/USD struggles for direction amid USD gains

EUR/USD is trimming part of its earlier gains, coming under some mild downside pressure near 1.1730 as the US Dollar edges higher. Markets are still digesting the Fed’s latest rate decision, while also looking ahead to more commentary from Fed officials in the sessions ahead.

GBP/USD drops to daily lows near 1.3360

Disappointing UK data weighed on the Sterling towards the end of the week, triggering a pullback in GBP/USD to fresh daily lows near 1.3360. Looking ahead, the next key event across the Channel is the BoE meeting on December 18.

Gold losses momentum, challenges $4,300

Gold now gives away some gains and disputes the key $4,300 zone per troy ounce following earlier multi-week highs. The move is being driven by expectations that the Fed will deliver further rate cuts next year, with the yellow metal climbing despite a firmer Greenback and rising US Treasury yields across the board.

Litecoin Price Forecast: LTC struggles to extend gains, bullish bets at risk

Litecoin (LTC) price steadies above $80 at press time on Friday, following a reversal from the $87 resistance level on Wednesday. Derivatives data suggests a bullish positional buildup while the LTC futures Open Interest declines, flashing a long squeeze risk.

Big week ends with big doubts

The S&P 500 continued to push higher yesterday as the US 2-year yield wavered around the 3.50% mark following a Federal Reserve (Fed) rate cut earlier this week that was ultimately perceived as not that hawkish after all. The cut is especially boosting the non-tech pockets of the market.

Aave Price Forecast: AAVE primed for breakout as bullish signals strengthen

Aave (AAVE) price is trading above $204 at the time of writing on Friday and approaching the upper boundary of its descending parallel channel; a breakout from this structure would favor the bulls.