|

NZD/JPY Price Analysis: Sellers moved in, as a bearish-pennant emerges

  • NZD/JPY is subdued as the Asian session begins, following the formation of a doji, portraying indecision amongst traders.
  • Bearish pennant in the NZD/JPY 1-hour chart warrants downward pressure lying ahead.

NZD/JPY failed to gain traction upward/downwards on Wednesday’s session, and meanders at around this week’s lows, as Thursday’s Asian Pacific session begins. At the time of writing, the NZD/JPY exchanges hands at 82.87, almost flat.

The NZD/JPY daily chart portrays the cross-currency pair as neutral to slightly downward biased, though it failed to gain traction on Wednesday. A doji surfaced nearby the low of the week of 82.65, which could exacerbate a consolidation in the near term. If that scenario plays out, the NZD/JPY will trade within the 82.65-83.00 for the remainder of the session unless a catalyst triggers the NZD/JPY to break above/below the range.

Upwards, the NZD/JPY first resistance would be the 20-day Exponential Moving Average (EMA) at 83.44, ahead of the 200-day EMA at 83.85. On the downside, the NZD/JPY’s next support would be the lows of the week at 82.65, followed by the psychological 82.00 mark

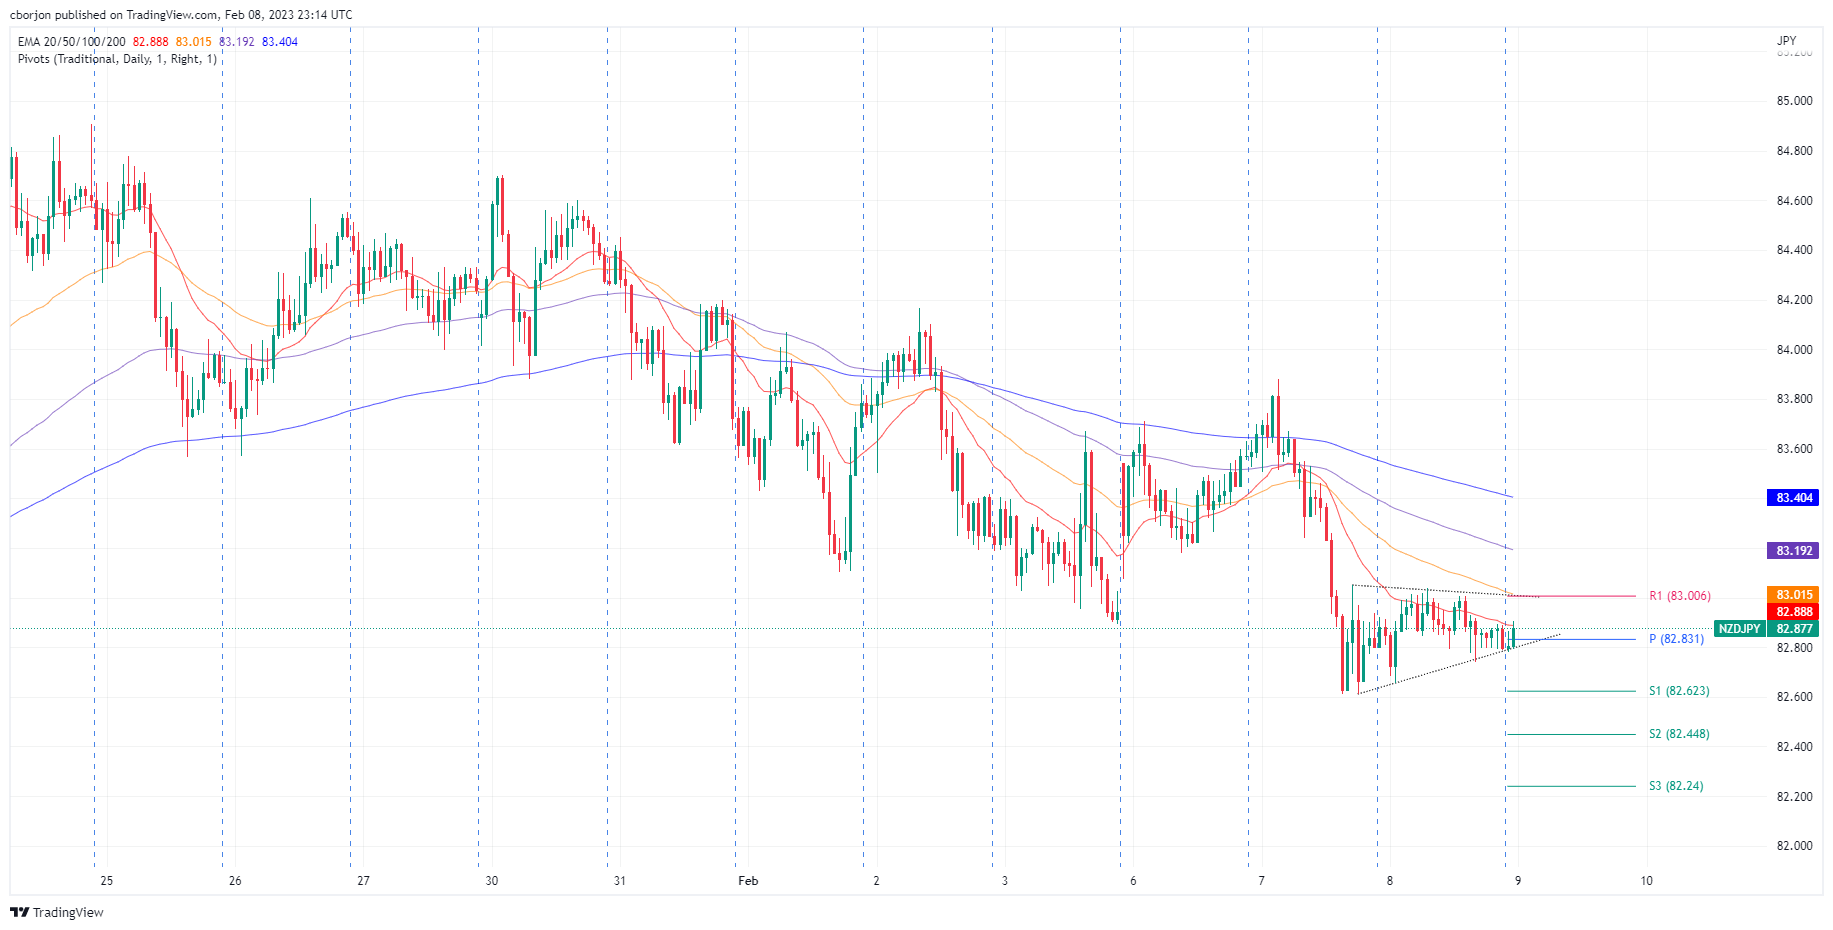
In the short term, the NZD/JPY1-hour chart portrays the formation of a bearish-pennant, which suggests downward action lies ahead. A break below the pennant bottom-trendline will pave the way for further losses and, on its first leg-down, would slide toward the S1 daily pivot at 82.62.

The NZD/JPY downtrend’s next stop would be the S2 pivot at 82.44, ahead of the S3 daily pivot at 82.24.

NZD/JPY: One-hour chart

NZD/JPY key technical levels

NZD/JPY

Overview
Today last price82.83
Today Daily Change-0.01
Today Daily Change %-0.01
Today daily open82.84
 
Trends
Daily SMA2083.45
Daily SMA5084.47
Daily SMA10084.53
Daily SMA20084.54
 
Levels
Previous Daily High83.88
Previous Daily Low82.62
Previous Weekly High84.7
Previous Weekly Low82.78
Previous Monthly High84.93
Previous Monthly Low81.04
Daily Fibonacci 38.2%83.1
Daily Fibonacci 61.8%83.4
Daily Pivot Point S182.34
Daily Pivot Point S281.84
Daily Pivot Point S381.07
Daily Pivot Point R183.61
Daily Pivot Point R284.38
Daily Pivot Point R384.88

Author

Christian Borjon Valencia

Christian Borjon began his career as a retail trader in 2010, mainly focused on technical analysis and strategies around it. He started as a swing trader, as he used to work in another industry unrelated to the financial markets.

More from Christian Borjon Valencia
Share:

Markets move fast. We move first.

Orange Juice Newsletter brings you expert driven insights - not headlines. Every day on your inbox.

By subscribing you agree to our Terms and conditions.

Editor's Picks

EUR/USD moves sideways below 1.1800 on Christmas Eve

EUR/USD struggles to find direction and trades in a narrow channel below 1.1800 after posting gains for two consecutive days. Bond and stock markets in the US will open at the usual time and close early on Christmas Eve, allowing the trading action to remain subdued. 

GBP/USD keeps range around 1.3500 amid quiet markets

GBP/USD keeps its range trade intact at around 1.3500 on Wednesday. The Pound Sterling holds the upper hand over the US Dollar amid pre-Christmas light trading as traders move to the sidelines heading into the holiday season. 

Gold retreats from record highs, trades below $4,500

Gold retreats after setting a new record-high above $4,520 earlier in the day and trades in a tight range below $4,500 as trading volumes thin out ahead of the Christmas break. The US Dollar selling bias remains unabated on the back of dovish Fed expectations, which continues to act as a tailwind for the bullion amid persistent geopolitical risks.

Bitcoin slips below $87,000 as ETF outflows intensify, whale participation declines

Bitcoin price continues to trade around $86,770 on Wednesday, after failing to break above the $90,000 resistance. US-listed spot ETFs record an outflow of $188.64 million on Tuesday, marking the fourth consecutive day of withdrawals.

Economic outlook 2026-2027 in advanced countries: Solidity test

After a year marked by global economic resilience and ending on a note of optimism, 2026 looks promising and could be a year of solid economic performance. In our baseline scenario, we expect most of the supportive factors at work in 2025 to continue to play a role in 2026.

Avalanche struggles near $12 as Grayscale files updated form for ETF

Avalanche trades close to $12 by press time on Wednesday, extending the nearly 2% drop from the previous day. Grayscale filed an updated form to convert its Avalanche-focused Trust into an ETF with the US Securities and Exchange Commission.