|

NZD/JPY Price Analysis: New Zealand CPI helps it to pierce weekly falling trendline

  • NZD/JPY trades near two-day high after New Zealand’s Q4 CPI rose beyond expectations.
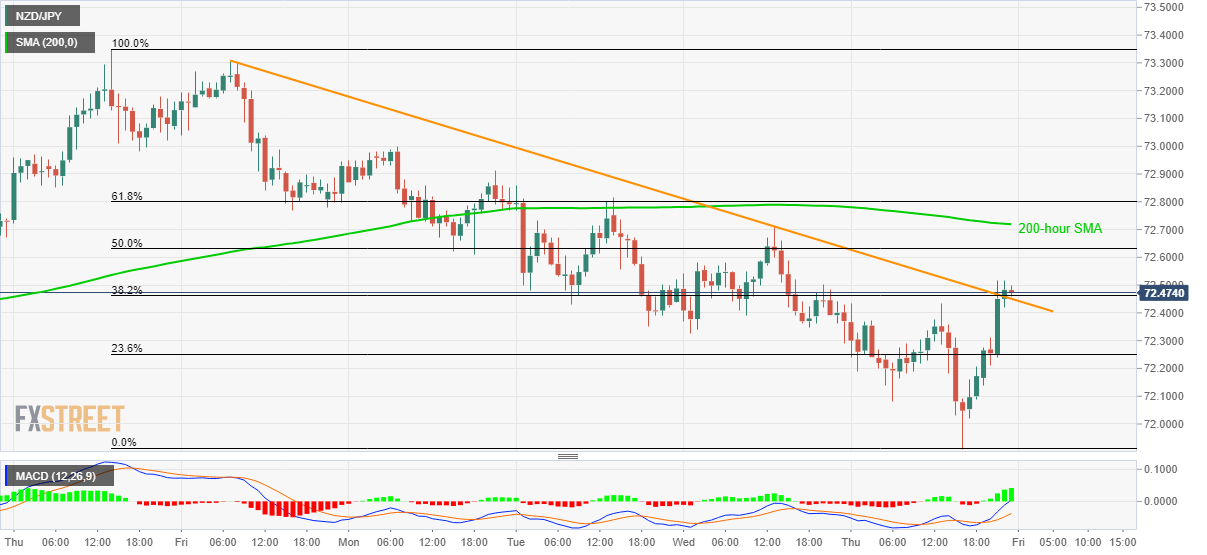
  • The pair now heads to 200-hour SMA.
  • 23.6% of Fibonacci retracement can offer immediate support.

NZD/JPY takes the bids to 72.50 during early Friday morning in Asia. In doing so, the pair crosses a one-week-old falling resistance line. The buyers seem to cheer upbeat data from New Zealand while portraying the recent run-up.

Read: Breaking: New Zealand Q4 CPI: YoY 1.9% / QoQ 0.5% (NZD bullish)

A 200-hour SMA level of 72.72 is a nearby upside barrier that the bulls are currently targeting. Though, 61.8% Fibonacci retracement of the pair’s declines from January 16 to 23, at 72.80, could restrict the pair’s further advances.

In a case where the NZD/JPY prices rally beyond 72.80, 73.00 can offer an intermediate halt to the rise targeting January 16 top surrounding 73.35.

Alternatively, pair’s downside break below 23.6% Fibonacci retracement level of 72.25 can recall Thursday’s low of 71.91 ahead of challenging the monthly bottom near 71.25.

NZD/JPY hourly chart

Trend: Bullish

Additional important levels

Overview
Today last price72.46
Today Daily Change2 pips
Today Daily Change %0.03%
Today daily open72.44
 
Trends
Daily SMA2072.73
Daily SMA5071.68
Daily SMA10070.15
Daily SMA20070.69
 
Levels
Previous Daily High72.71
Previous Daily Low72.33
Previous Weekly High73.35
Previous Weekly Low72.35
Previous Monthly High73.57
Previous Monthly Low70.37
Daily Fibonacci 38.2%72.56
Daily Fibonacci 61.8%72.47
Daily Pivot Point S172.28
Daily Pivot Point S272.11
Daily Pivot Point S371.89
Daily Pivot Point R172.66
Daily Pivot Point R272.88
Daily Pivot Point R373.04

Author

Anil Panchal

Anil Panchal

FXStreet

Anil Panchal has nearly 15 years of experience in tracking financial markets. With a keen interest in macroeconomics, Anil aptly tracks global news/updates and stays well-informed about the global financial moves and their implications.

More from Anil Panchal
Share:

Editor's Picks

EUR/USD appears supported by the 200-day SMA, for now

Following an early pullback to multi-week lows near 1.1670, EUR/USD now manages to reclaim the 1.1700 region as the NA session draws to a close on Monday. The steep retracement in spot follows the equally strong move higher in the US Dollar, as investors continue to assess the geopolitical landscape in the wake of the US and Israel attacks on Iran.


GBP/USD hits new yearly lows near 1.3300

GBP/USD adds to the recent bearish tone, approaching to the key 1.3300 support to reach fresh YTD troughs against the backdrop of the robust performance of the US Dollar. Indeed, Cable’s decline comes amid the firm demand for the safe-haven space in the wake of the US and Israel attacks to Iran.

Gold eases some ground, approaches $5,300

Gold now surrenders part of the earlier advance, reshifting its attenton to the $5,300 zone per troy ounce at the beginning of the week. Indeed, the yellow metal’s firm performance appears propped up by incresing geopolitical jitters in the Middle East, which at the same time fuels the demand for the safe-haven space.

Strategy lifts holdings to 3.4% of Bitcoin's total supply amid inflows into crypto products

Strategy continued its accumulation of the top crypto last week, acquiring 3,015 BTC for $204 million amid renewed interest in crypto products after four weeks of outflows.

The Fed is finally talking about AI – Here's why it matters for the US Dollar

AI is moving from earnings calls into the heart of monetary policy discussions, forcing Federal Reserve officials to confront a new question: How to act if AI reshapes inflation, employment and interest rates at the same time?

Grass 20% bullish breakout defies broader market weakness

Grass (GRASS) is edging up above $0.30 at the time of writing on Monday. The token’s notable 20% intraday surge stands out amid heightened volatility in the broader crypto market.