• The NZD/JPY finished Tuesday’s session flat, as the Asian Pacific session is about to begin.
  • Reports from Eastern Europe shed some light on a meeting between Putin and Zelensky.
  • NZD/JPY Price Forecast: Price action over the last two days suggests consolidation lies ahead.

The NZD/JPY grinds lower on Tuesday, although an improved risk appetite as positive news from Eastern Europe suggests that Russia and Ukraine might be finding some agreements in their postures, which could trigger a cease-fire and find a diplomatic solution to the war. At 85.20. the NZD/JPY does not reflect the aforementioned, as the end of the Japanese fiscal year looms, meaning that the yen strengthened on month-end flows.

Market sentiment improved on Tuesday as reports from the Russia - Ukraine front increased the prospects of a cease-fire between both parties. As reported by a CNN reporter on Twitter, it is possible a reunion between Russian President Vladimir Putin and Ukraine’s President Volodymyr Zelenskyy, as stated by Ukrainian President Advisor Podolyak.

The optimistic tone lifted US equities, which ended in the green, gaining between 097% and 2.55%. The so-called “fear index,” the CBOE Volatility Index (VIX), dropped below 20, sits at 18.90, down 3.72%, reflecting confidence in investors.

In the FX space, the low yielder EUR and safe-haven peers benefitted, particularly the Japanese yen.

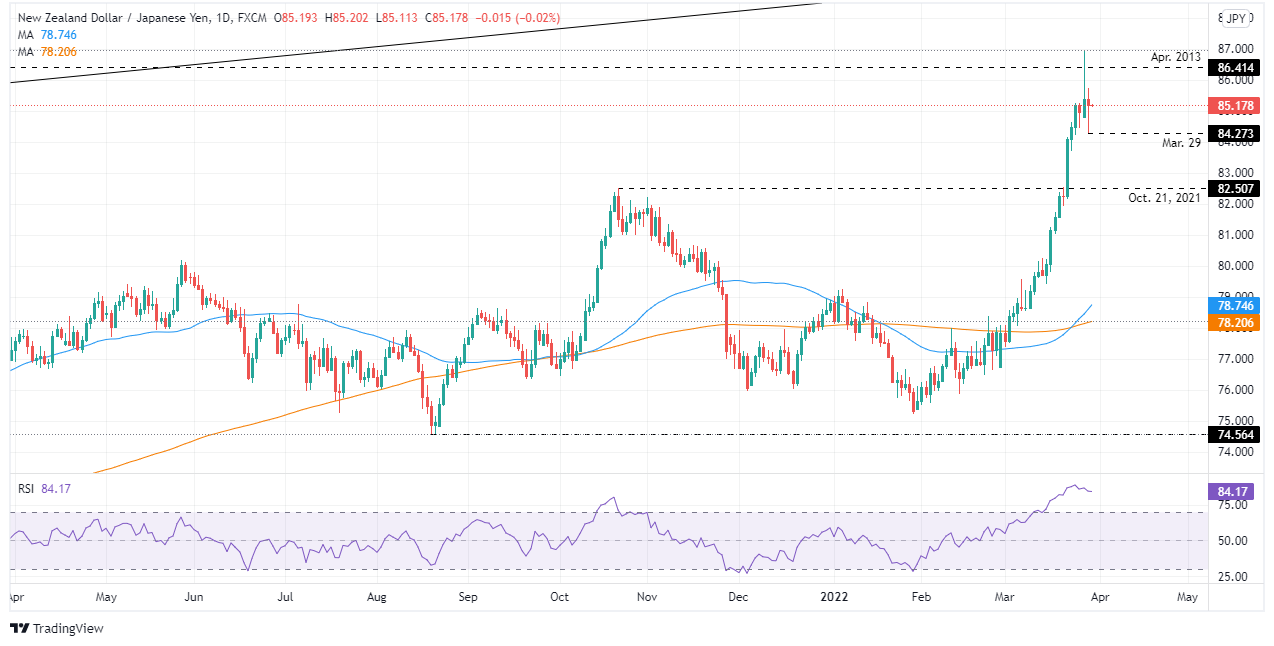
Aside from this, in the overnight session for North American traders, the NZD/JPY seesawed in the 85.30-80 range. However, late in the European session, it dropped below the 85.00 mark, reaching a daily low at 84.27, recovering later as the New York session ended, reclaiming the 85.00.

NZD/JPY Price Forecast: Technical outlook

The NZD/JPY printed an inverted hammer after a steeper upward move towards 87.00, followed by a regular hammer, but on a lower note, as the close is above the open. Those two candlesticks themselves signal that the upward bias could shift to consolidation, despite that the daily moving averages (DMAs) reside below the spot price.

With that said, the NZD/JPY first resistance would be 85.73. Breach of the latter would expose 86.00, followed by April 2013 high at 86.41, and then the multi-year-high reached on Monday at 86.95.

On the flip side, the NZD/JPY first support would be 85.00. A sustained break could lead towards March 29 low at 84.27, followed by the 84.00 mark, and then October 21, 2021, daily high at 82.50.

NZD/JPY

Overview
Today last price 85.20
Today Daily Change -0.25
Today Daily Change % -0.29
Today daily open 85.44
 
Trends
Daily SMA20 81.05
Daily SMA50 78.48
Daily SMA100 78.37
Daily SMA200 78.18
 
Levels
Previous Daily High 86.96
Previous Daily Low 84.82
Previous Weekly High 85.25
Previous Weekly Low 81.92
Previous Monthly High 78.38
Previous Monthly Low 75.53
Daily Fibonacci 38.2% 86.14
Daily Fibonacci 61.8% 85.64
Daily Pivot Point S1 84.52
Daily Pivot Point S2 83.59
Daily Pivot Point S3 82.37
Daily Pivot Point R1 86.66
Daily Pivot Point R2 87.89
Daily Pivot Point R3 88.81


Share: Feed news

Information on these pages contains forward-looking statements that involve risks and uncertainties. Markets and instruments profiled on this page are for informational purposes only and should not in any way come across as a recommendation to buy or sell in these assets. You should do your own thorough research before making any investment decisions. FXStreet does not in any way guarantee that this information is free from mistakes, errors, or material misstatements. It also does not guarantee that this information is of a timely nature. Investing in Open Markets involves a great deal of risk, including the loss of all or a portion of your investment, as well as emotional distress. All risks, losses and costs associated with investing, including total loss of principal, are your responsibility. The views and opinions expressed in this article are those of the authors and do not necessarily reflect the official policy or position of FXStreet nor its advertisers. The author will not be held responsible for information that is found at the end of links posted on this page.

If not otherwise explicitly mentioned in the body of the article, at the time of writing, the author has no position in any stock mentioned in this article and no business relationship with any company mentioned. The author has not received compensation for writing this article, other than from FXStreet.

FXStreet and the author do not provide personalized recommendations. The author makes no representations as to the accuracy, completeness, or suitability of this information. FXStreet and the author will not be liable for any errors, omissions or any losses, injuries or damages arising from this information and its display or use. Errors and omissions excepted.

The author and FXStreet are not registered investment advisors and nothing in this article is intended to be investment advice.

Recommended content


Recommended content

Editors’ Picks

EUR/USD tumbles to new lows, breaks below 1.1600

EUR/USD tumbles to new lows, breaks below 1.1600

On Tuesday, the US Dollar Index (DXY) reached new highs, while EUR/USD fell to new multi-week lows in the sub-1.1600 support level.  The solid US CPI data reinforced the Fed's cautious narrative, providing the Dollar a boost at the cost of risk assets.

GBP/USD faces heavy losses below the 1.3400 mark

GBP/USD faces heavy losses below the 1.3400 mark

Extra weakness continues to hurt the sterling on Tuesday. In fact, GBP/USD now extends its recent breach below the important 1.3400 support level and flirts with four-week lows as sentiment towards the US dollar strengthens. Later in the day, investors are anticipated to closely follow presentations by Governor Bailey and Chancellor Reeves at the Mansion House event.

Gold's selling pressure picks up pace, focus on $3,320

Gold's selling pressure picks up pace, focus on $3,320

Gold prices now lose the grip and prompt the precious metal to retreat to daily troughs near the $3,320 mark per troy ounce. The increasing selling pressure around the yellow metal comes in response to a stronger US Dollar, rising US yields across the curcve, and the idea that the Fed might remain cautious for longer.

Pi Network Price Forecast: PI test crucial support level amid bullish RSI divergence

Pi Network Price Forecast: PI test crucial support level amid bullish RSI divergence

Pi Network edges lower by 2% at press time on Tuesday, failing to join the bandwagon of altcoins fueled by Bitcoin reaching record high levels. The increasing supply pressure on Centralized Exchanges and the token unlocks fuel the declining trend in PI token, resulting in a retest of the $0.4460 support level.

China’s first-half growth remains on track, though activity data signals caution

China’s first-half growth remains on track, though activity data signals caution

China's second-quarter GDP beat forecasts again with a 5.2% year-on-year growth, driven by strong trade and industrial production. Yet sharper-than-expected slowdowns in fixed-asset investment and retail sales and falling property prices are a concern.

Best Brokers for EUR/USD Trading

Best Brokers for EUR/USD Trading

SPONSORED Discover the top brokers for trading EUR/USD in 2025. Our list features brokers with competitive spreads, fast execution, and powerful platforms. Whether you're a beginner or an expert, find the right partner to navigate the dynamic Forex market.

Forex MAJORS

Cryptocurrencies

Signatures

Best Brokers of 2025