NVIDIA Stock Price and Forecast: NVDA heads back to $300
- Nvidia shares continue to slow from all-time highs.
- Earnings had powered NVDA stock as revenue and forecasts remain strong.
- Semiconductor stocks are strong, but NVDA has surged over 140% in 2021.

Nvidia (NVDA) stock retreated some more on Tuesday, but the stock still remains close to all-time highs.
-637733490407840276.png)
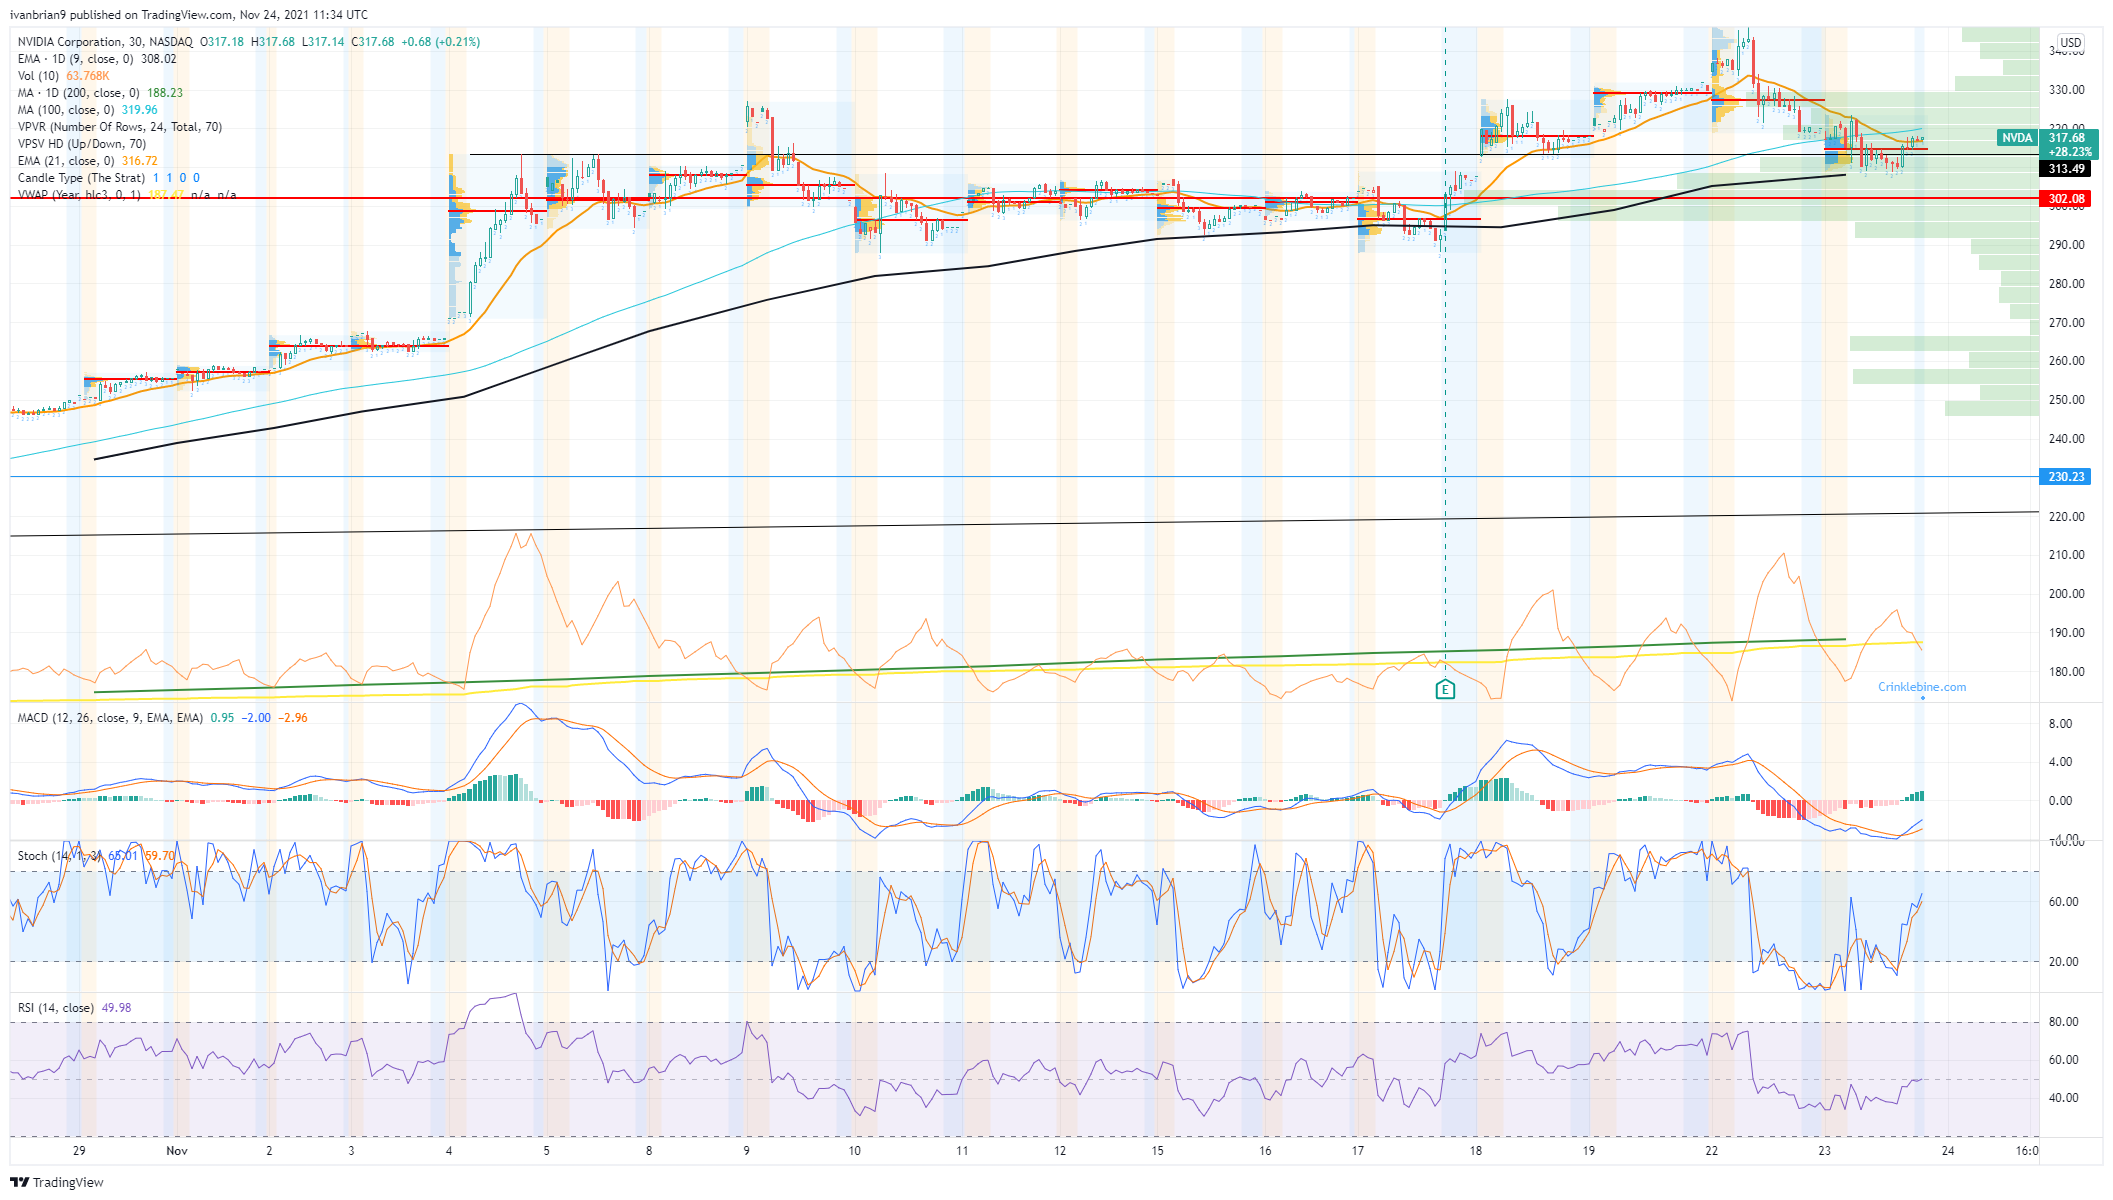
NVDA stock, 15-minute
Nvidia stock was down nearly 3% at one stage late on Tuesday, but a rally in the last hour of trading helped it recover and saw Nvidia lose only 0.7%. Monday had seen the stock set a new all-time high at $346.47.
Nvidia (NVDA) stock news
There has been some decent insider selling since the earnings report as blackout ends. Tuesday saw a decent sale of 58,000 shares worth nearly $20 million. Apart from that news flow is relatively calm in this one.
The proposed deal for ARM still lingers on. ARM is a UK chip manufacturer that NVDA is trying to purchase, but the UK government has reservations over national security issues and is examining the issue. While ARM is actually owned by SoftBank of Japan, it is still seen as strategically important by the UK. The FT also reported last week that US regulators have raised some objections to the ARM acquisition, putting further regulatory roadblocks in front of the deal.
The Daily Mail carried an article saying that UK ministers believe the deal will not go ahead. "A Whitehall source said: 'Many in government don't think the deal will go through and want to see the company returned to the London Stock Exchange.' "
The EU will also conduct an in-depth probe into the deal, which would be worth around $40 billion. SoftBank acquired ARM in 2016 for £24 billion ($31 billion).
Nvidia (NVDA) stock forecast
Intraday there is quite a bit of support at $302. This is the point of control since earnings, and as we can see from the 30-minute chart below, this is a high volume area. Volume equals stability and so equals support in this case. Breaking $300 is not only psychological but puts NVDA into a volume vacuum until $265.
The daily chart shows support at $310 from the 9-day moving average, and this is also the top of the flag formation that NVDA stock has now retraced to. Holding $310 keeps the short-term trend bullish, below it is neutral. The stock though would not turn technically bearish until $267.
A close eye should be kept on the MACD as it looks to cross and, therefore, confirms the bearish crossover in the stochastic. We also have a bearish divergence from the Relative Strength Index (RSI). In our view dips are there to be bought until $302 is broken. This is stronger that the $310 support mentioned as there is more volume at $302. We always place more importance on volume at price rather than just price alone.
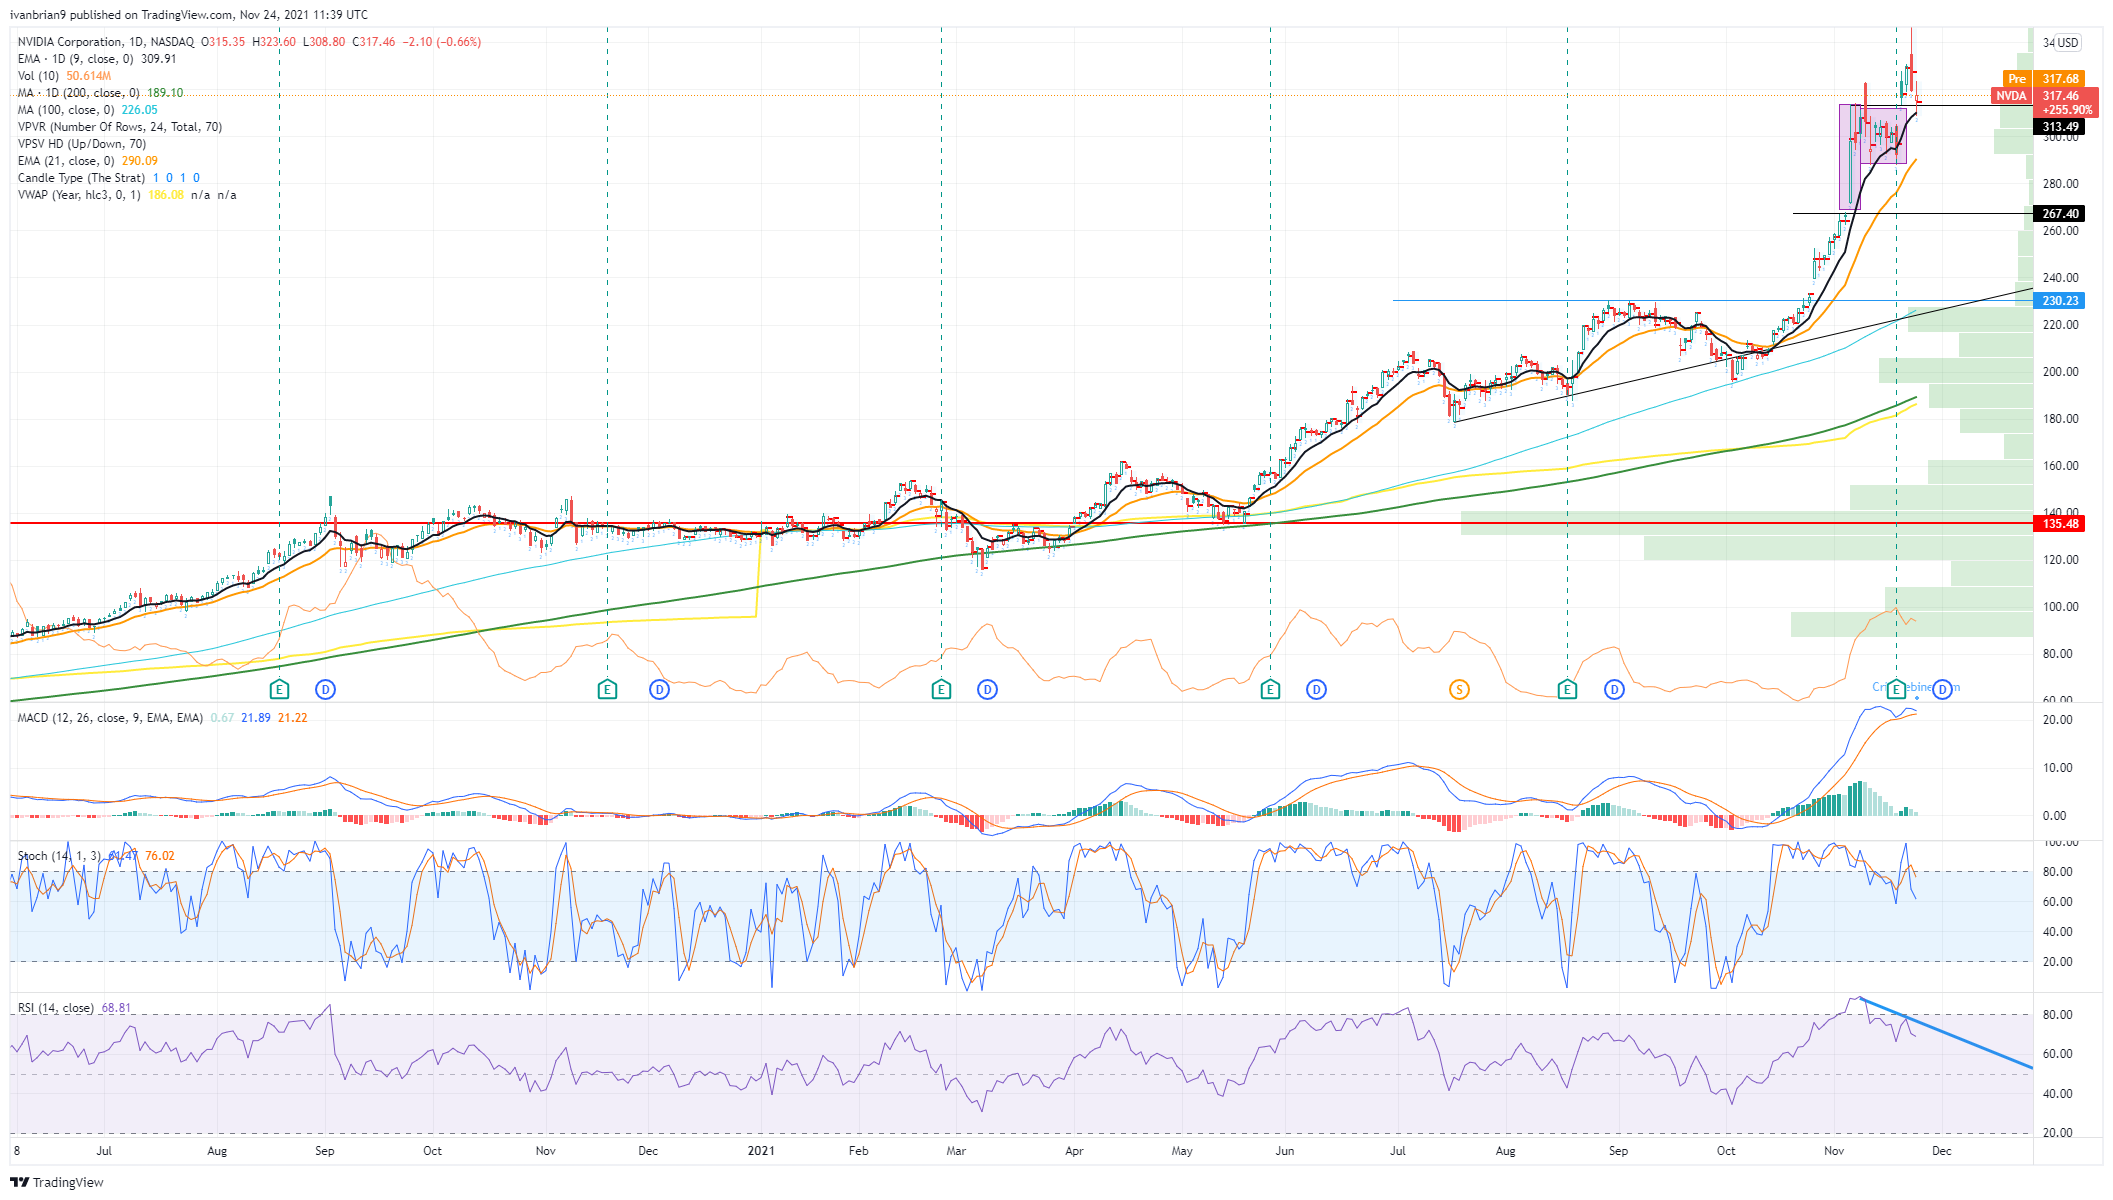
NVDA 1-day chart
Premium
You have reached your limit of 3 free articles for this month.
Start your subscription and get access to all our original articles.
Author

Ivan Brian
FXStreet
Ivan Brian started his career with AIB Bank in corporate finance and then worked for seven years at Baxter. He started as a macro analyst before becoming Head of Research and then CFO.


