Nvidia Stock Forecast: NVDA recovers after US CPI undershoots
- NVDA stock traded higher on Thursday after US CPI data failed to meet expectations.
- This came after weakness suffered on Wednesday following Biden semiconductor export limits.
- NASDAQ 100 futures rose 1.1% early Thursday on CPI beat.
- Chinese tech giants have at least $9 billion worth of orders for Nvidia’s A800 GPU.

Nvidia (NVDA) stock reversed course and moved above the 50-day Simple Moving Average (SMA) temporarily on Thursday after the US Consumer Price Index (CPI) for July came in below expectations. The result especially boosted tech stocks, and the NASDAQ Composite jumped 1.6% on the news.
Core CPI rose 4.7% YoY, and headline inflation gained 3.2% YoY. Both readings were 10 basis points below consensus.
Nvidia, a leading AI-chip manufacturer, dropped 4.7% on Wednesday following news that US President Joe Biden has signed an executive order to limit investment by US corporations in specific Chinese hi-tech industries, that constitute a core segment of Nvidia's market.
Nvidia stock news: Biden administration to limit Chinese investment
Wednesday afternoon the Biden administration adopted an executive order that would limit US corporations from investing in the semiconductor, microelectronic, quantum information technology, and artificial intelligence industries of China. The latter’s foreign ministry decried the new stringent regulations.
"This program will seek to prevent foreign countries of concern from exploiting U.S. investment in this narrow set of technologies that are critical to support their development of military, intelligence, surveillance, and cyber-enabled capabilities that risk US national security," the White House said in a written statement.
The Financial Times simultaneously reported that Chinese heavyweights in the consumer internet sector have ordered more than $5 billion worth of Nvidia chips in an attempt to stockpile them ahead of a more restrictive environment. Those tech companies include Alibaba (BABA), Tencent (TCEHY), Baidu (BIDU) and ByteDance – which all have orders for upwards of $1 billion worth of A800 GPUs with delivery timelines in 2023. For 2024, they have at least another $4 billion worth of orders already penciled in.
Nvidia designed the A800 last year in order to circumvent rules from Washington regarding state-of-the-art semiconductor technology headed to China. The A800 has a slower transfer rate than the A100 it is modeled on that is used in data centers to deal with the heavy compute required for training large language models and other generative AI technologies.
On Monday, a Morgan Stanley team released a client note arguing that the AI rally this year is in its “later innings”. Noting that Nvidia and other prominent AI-related stocks have more than tripled their share prices year to date, the team captained by equity strategist Edward Stanley said that this rally had already surpassed other niche bubbles that on average see gains of 150% over a three-year period.
Citi reiterated its Buy rating and $560 price target on NVDA stock on Wednesday following Nvidia’s unveiling of its GH200 Grace-Hopper superchip. The chip platform comes with triple the bandwidth and memory of the most recent generation of chips and is designed to deal with heavier generative AI workloads at data centers.
Nvidia is slated to report second-quarter earnings on August 23. After the company raised its outlook last quarter, Wall Street analysts now expected adjusted earnings per share (EPS) of $2.07 on revenues of $11.06 billion.
Semiconductor stocks FAQs
What is a semiconductor?
A semiconductor is a term for various types of computer chips. Officially called semiconductor devices, these computer chips rely on semiconductor materials like silicon and gallium arsenide to process the electrical current that produces the modern world of computing. They come in many shapes, sizes, enhancements and configurations such as diodes, transistors and integrated circuits to more complicated applications like DRAM memory, simple processors and even GPUs.
What types of semiconductor companies are there?
First, there are the pure chip designers, such as Nvidia, AMD, Broadcom and Qualcomm. These companies use sophisticated software to design and test chips. Second, there are the equipment manufacturers that provide the machines necessary to build computer chips. These include ASML and Lam Research. Then, there are foundries that manufacture the chips. These include Taiwan Semiconductor and GlobalFoundries. Last of all are the integrated device manufacturers who design their own chips and additionally manufacture themselves. These include Samsung and Intel.
What is Moore’s Law?
It is the observation that the number of transistors in an integrated circuit doubles every two years. The “law” is named after Gordon Moore, who founded Fairchild Semiconductor and later Intel. The doubling is possible due to the shrinking size of process nodes or parts in the computer chip. In 1971 the advanced commercial manufacturing had reached 10 microns in width. In 1987 semiconductor technology had advanced to 800 nanometers in width. By 1999, this process had moved to 180 nanometers. By 2007, the size had dropped to 32 nanometers, and this fell all the way to 3 nanometers in 2022, which is close to the size of human DNA.
How large is the semiconductor industry?
In 2022, the global semiconductor industry had revenues just under $600 billion. In total, the industry shipped 1.15 trillion semiconductor units in 2021. The leading nations involved in the semiconductor supply chain are Taiwan, the United States, China, the Netherlands, South Korea, Japan and Israel.
Nvidia stock forecast: A break of 50-day SMA speaks volumes
As previously mentioned, NVDA stock closed below the 50-day SMA on Wednesday. It has traded above this moving average since January 9, so that works out to roughly an 8-month uptrend.
Nvidia stock had to consolidate at some point, and there are plenty of support levels nearby that might serve as decent entries for longs. It is now trading right near the $420 price level that served as both resistance (May 30) and support (June and July). The $400 level worked as support on several occasions from May 30 through June 26, and below there comes the demand zone stretching from $373 to $378.
The Moving Average Convergence Divergence (MACD) began its bearish turn lower in late June and it could soon trend below the zero threshold, which would be a much stronger bearish warning for bulls. In mid-July, Nvidia stock ran into stubborn resistance just around $480.
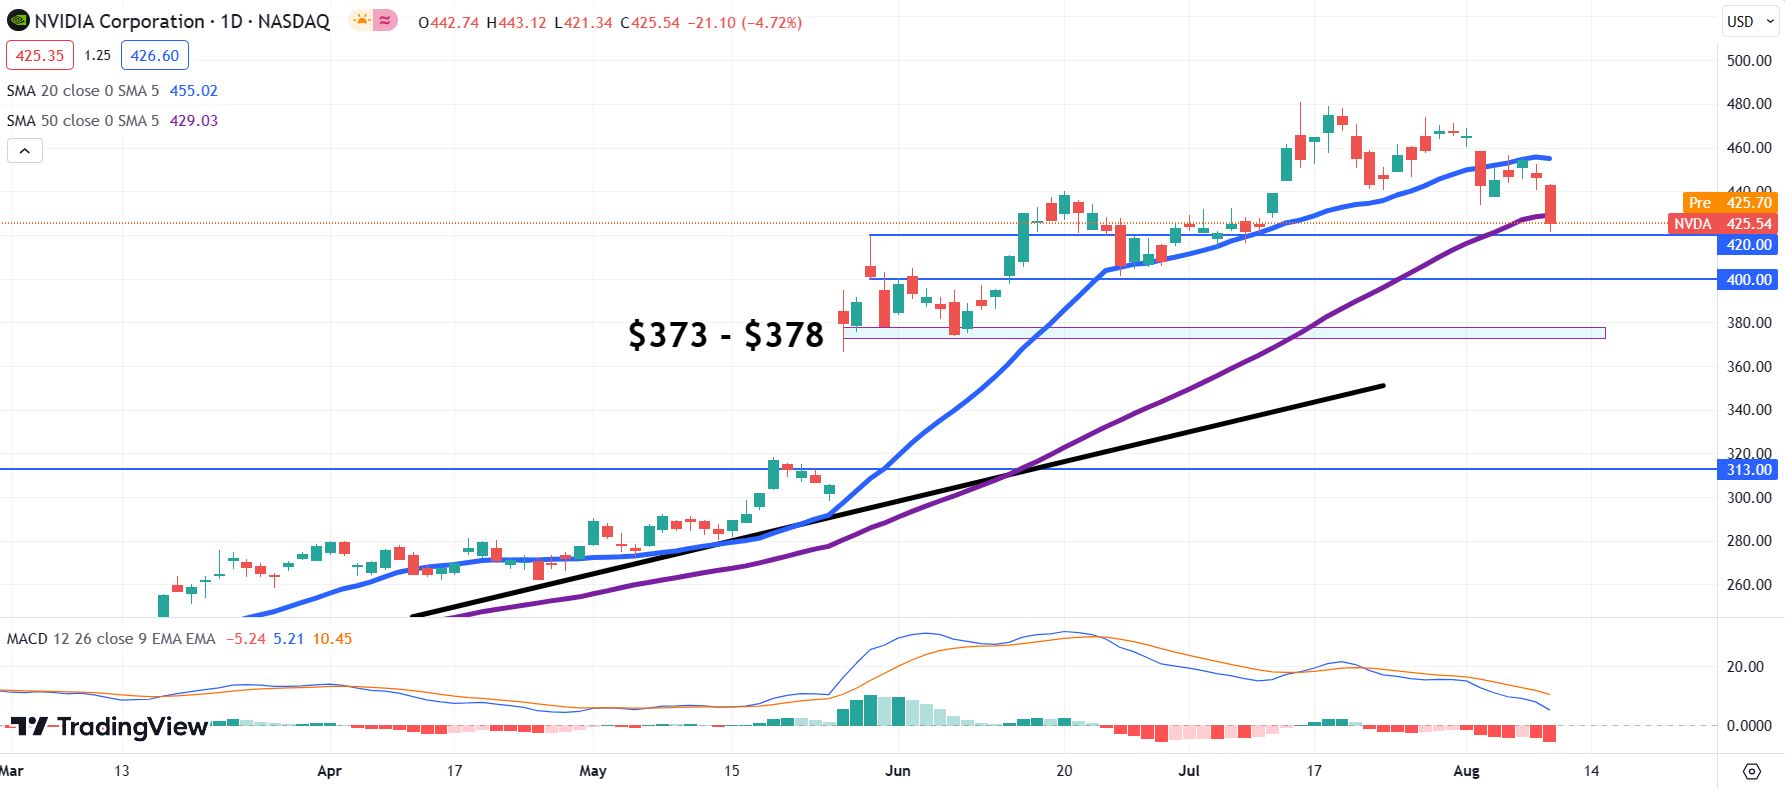
NVDA daily chart
Premium
You have reached your limit of 3 free articles for this month.
Start your subscription and get access to all our original articles.
Author

Clay Webster
FXStreet
Clay Webster grew up in the US outside Buffalo, New York and Lancaster, Pennsylvania. He began investing after college following the 2008 financial crisis.


