New Zealand Dollar weakens on negative economic outlook
- The New Zealand Dollar is trading lower in most pairs as the country’s economic growth stutters.
- Bearish technicals, showing a breakout from a price pattern, add fuel to the fire.
- The US Dollar strengthens on strong data, pushing NZD/USD down a step lower.

The New Zealand Dollar (NZD) is trading lower in most pairs, and is down by over half a percent against the US Dollar (USD) at just above 0.6000 on Friday, as a sluggish economic outlook weighs on the NZD.
New Zealand Dollar hit by negative GDP
The New Zealand Dollar is undermined by negative growth in New Zealand.
Recent data showed the New Zealand economy pitched into a technical recession in the fourth quarter of 2024. New Zealand Gross Domestic Product (GDP) shrank by 0.1% in Q4 when economists had expected a 0.1% rise, according to Statistics New Zealand. This followed a 0.3% contraction in Q3 – two quarters of negative growth mark a recession.
Despite the dismal growth data, the Reserve Bank of New Zealand (RBNZ) has not said it is ready to cut interest rates to try to stimulate growth. Inflation still remains relatively elevated at 4.7% in Q4, even though it fell from 5.6% previously and is slowly trending lower.
In an interview with Reuters this month, Reserve Bank of New Zealand Deputy Governor Christian Hawkesby said that interest rates, at a 15-year high of 5.5%, need to stay restrictive for some time.
Reuters places the consensus estimate for the RBNZ making an initial interest-rate cut in August.
Recent comments from The New Zealand finance minister, Nicola Willis, however, suggest the government may wish for interest rates to come down to help stimulate growth. Growth would be “significantly slower” than previously expected, said the minister, as higher interest rates had already dampened economic activity.
Part of the reason for the slowdown is China, which has experienced its own economic slowdown after years of stellar growth. China is New Zealand’s largest trading partner and a key market for New Zealand dairy goods, the country’s main export.
USD claws back losses on robust data
NZD/USD – the number of US Dollars one New Zealand Dollar can buy – has been especially hit after US PMI data on Thursday showed both the US services and manufacturing sectors remain in expansion territory in March – a comparatively robust result compared to most other developed nations.
The US S&P Global Composite PMI came out at 52.2, holding above the 50 level that distinguishes expansion from contraction.
US Manufacturing PMI came out at 52.5, beating estimates and previous figures, and Services PMI came out at 51.7 in March, still in growth territory, despite falling below estimates.
Other US data on Thursday showed the Philadelphia Fed Manufacturing Survey came out higher than estimated at 3.2, and Initial Jobless Claims at 210K were lower than the 215K forecast.
Overall, the data supported the US Dollar and helped it claw back losses after the Fed’s dovish meeting on Wednesday, where it continued to stubbornly hold onto the view that it expects to cut interest rates by three times in 2024.
Technical Analysis: New Zealand Dollar continues breakout from wedge pattern
NZD/USD continues its sharp decline after breaking out of the bottom of a long-term range.
The pair is in an established short-term downtrend and likely to form progressively lower peaks and troughs. Given the old adage that “the trend being your friend,” this suggests more downside as probable.
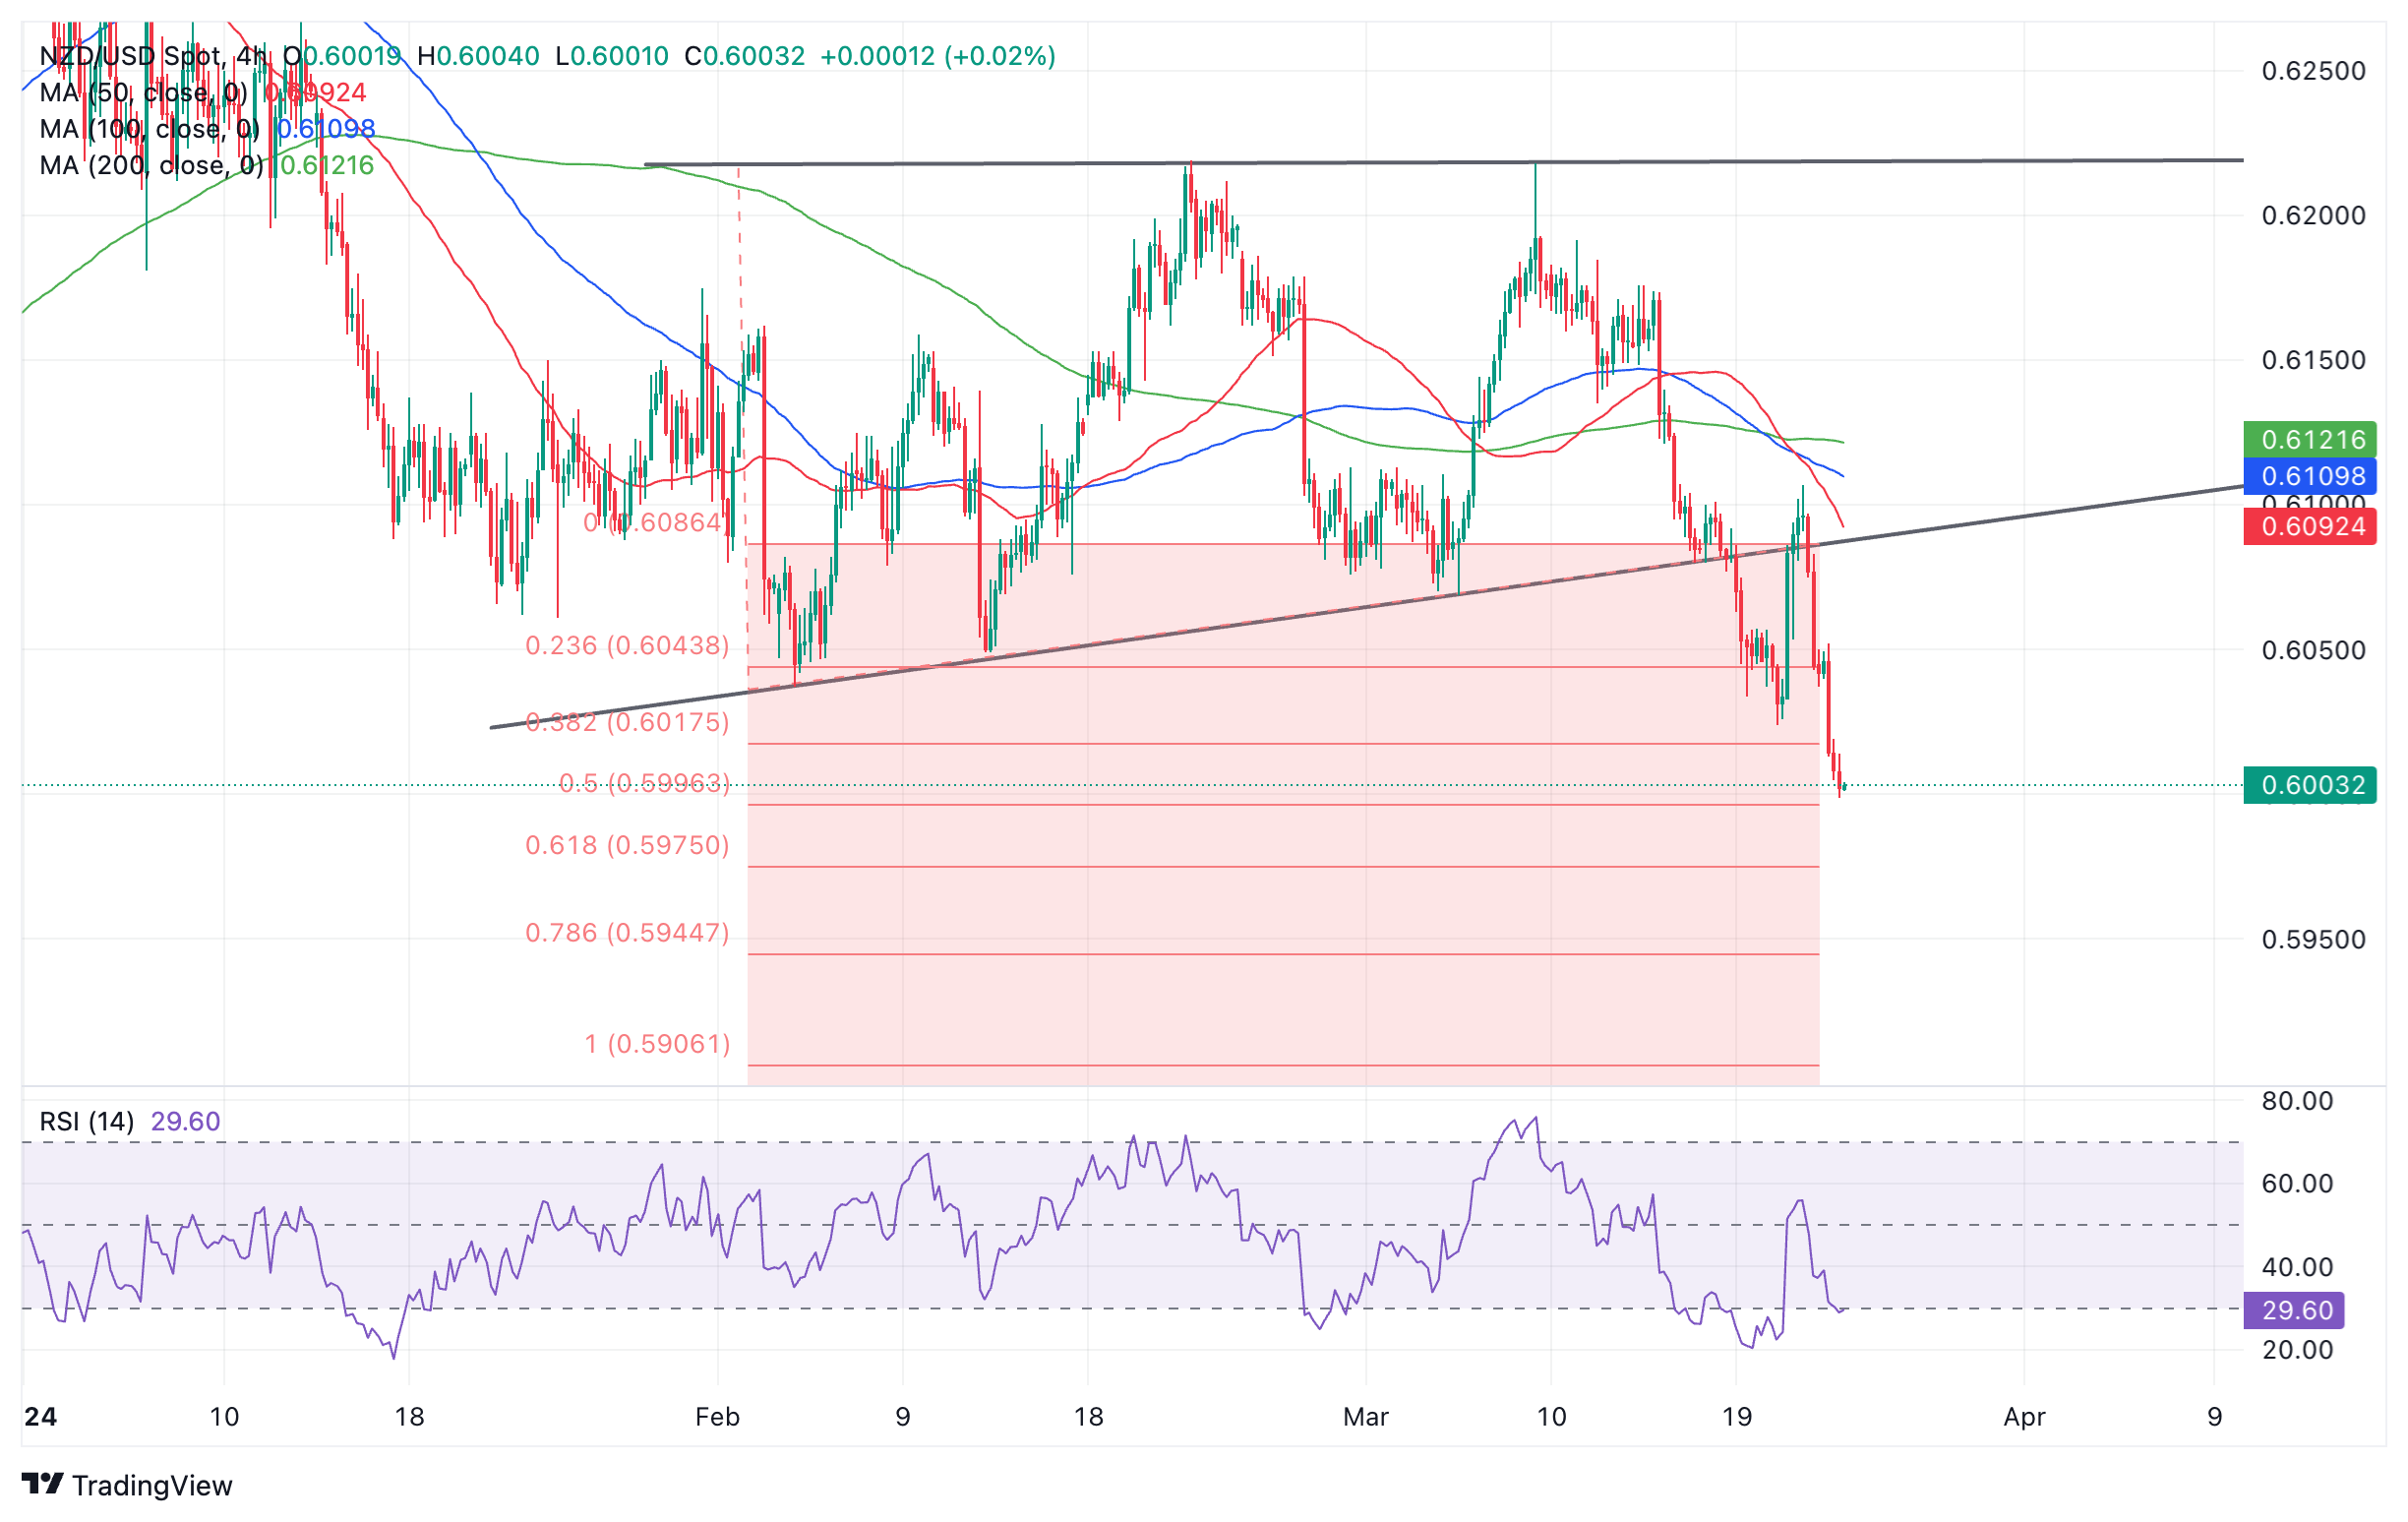
New Zealand Dollar versus US Dollar: 4-hour chart
NZD/USD is showing bullish convergence with the Relative Strength Index (RSI) momentum indicator, however. Convergence occurs when price makes a lower low but the RSI fails to. It indicates a possibility the pair could pull back, although the entrenched downtrend is likely to resume eventually.
The breakout from the long-term range is likely to extend further. According to technical analysis theory, the height of the range provides a guide as to how much lower the pair could go. In the case of NZD/USD it suggests more downside is on the horizon.
The 0.618 Fibonacci ratio of the height of the range extrapolated from the breakout point lower provides an initial target at 0.5975. The full ratio provides a further target at around 0.5906.
Only a break above the 0.6107 highs would bring into doubt the bearish bias.
RBNZ FAQs
The Reserve Bank of New Zealand (RBNZ) is the country’s central bank. Its economic objectives are achieving and maintaining price stability – achieved when inflation, measured by the Consumer Price Index (CPI), falls within the band of between 1% and 3% – and supporting maximum sustainable employment.
The Reserve Bank of New Zealand’s (RBNZ) Monetary Policy Committee (MPC) decides the appropriate level of the Official Cash Rate (OCR) according to its objectives. When inflation is above target, the bank will attempt to tame it by raising its key OCR, making it more expensive for households and businesses to borrow money and thus cooling the economy. Higher interest rates are generally positive for the New Zealand Dollar (NZD) as they lead to higher yields, making the country a more attractive place for investors. On the contrary, lower interest rates tend to weaken NZD.
Employment is important for the Reserve Bank of New Zealand (RBNZ) because a tight labor market can fuel inflation. The RBNZ’s goal of “maximum sustainable employment” is defined as the highest use of labor resources that can be sustained over time without creating an acceleration in inflation. “When employment is at its maximum sustainable level, there will be low and stable inflation. However, if employment is above the maximum sustainable level for too long, it will eventually cause prices to rise more and more quickly, requiring the MPC to raise interest rates to keep inflation under control,” the bank says.
In extreme situations, the Reserve Bank of New Zealand (RBNZ) can enact a monetary policy tool called Quantitative Easing. QE is the process by which the RBNZ prints local currency and uses it to buy assets – usually government or corporate bonds – from banks and other financial institutions with the aim to increase the domestic money supply and spur economic activity. QE usually results in a weaker New Zealand Dollar (NZD). QE is a last resort when simply lowering interest rates is unlikely to achieve the objectives of the central bank. The RBNZ used it during the Covid-19 pandemic.
Author

Joaquin Monfort
FXStreet
Joaquin Monfort is a financial writer and analyst with over 10 years experience writing about financial markets and alt data. He holds a degree in Anthropology from London University and a Diploma in Technical analysis.















