New Zealand Dollar depreciates after weaker consumer confidence
- The New Zealand Dollar weakens in its most traded pairs after weak consumer confidence data.
- The New Zealand economy suffers from the twin evils of high inflation and weak growth, further weighing on NZD.
- The NZD/USD chart is showing a bearish pattern underway with new lows probably on the radar.

The New Zealand Dollar (NZD) is weakening across the board on Thursday, after a leading indicator of consumer confidence in New Zealand deteriorated sharply in February.
The currency is further hampered by an economy that is suffering from the twin evils of high inflation and low growth, leaving the central bank with little room for maneuver.
New Zealand Dollar undermined by a weak Roy Morgan
The New Zealand Dollar has depreciated after a sharp fall in the Roy Morgan Consumer Confidence indicator, a leading index that measures the “level of consumer confidence in economic activity.”
The data released overnight showed the index falling to 86.4 in February from 94.5 in January, the lowest level since July 2023, according to ANZ bank.
-638472241243721101.png)
Roy Morgan Consumer Confidence: Monthly
New Zealand fell into a technical recession in Q4 of 2023, following two quarters of negative economic growth.
Inflation, as measured by the Consumer Price Index, remains relatively high at 4.7% in Q4 after falling from 5.6% in Q3. The largest contributor was Housing and Housing Utilities, which showed a 4.8% rise and accounts for the largest share of the basket.
The poor economic data suggests the Reserve Bank of New Zealand (RBNZ) is trapped: it must keep interest rates high at 5.5% in order to bring down inflation but would probably prefer to reduce interest rates to stimulate growth. This is probably a further factor weighing on the NZD.
The structural problem of a tight labor market due to insufficient workers limits growth and keeps wages relatively high.
Technical Analysis: New Zealand Dollar in bearish pattern against USD
NZD/USD price, which measures the buying power of one New Zealand Dollar in US Dollar (USD) terms, is falling in a bearish three-wave pattern, known as a Measured Move.
The pattern consists of three waves, usually labeled ABC, in which wave A and C are usually of the same length.
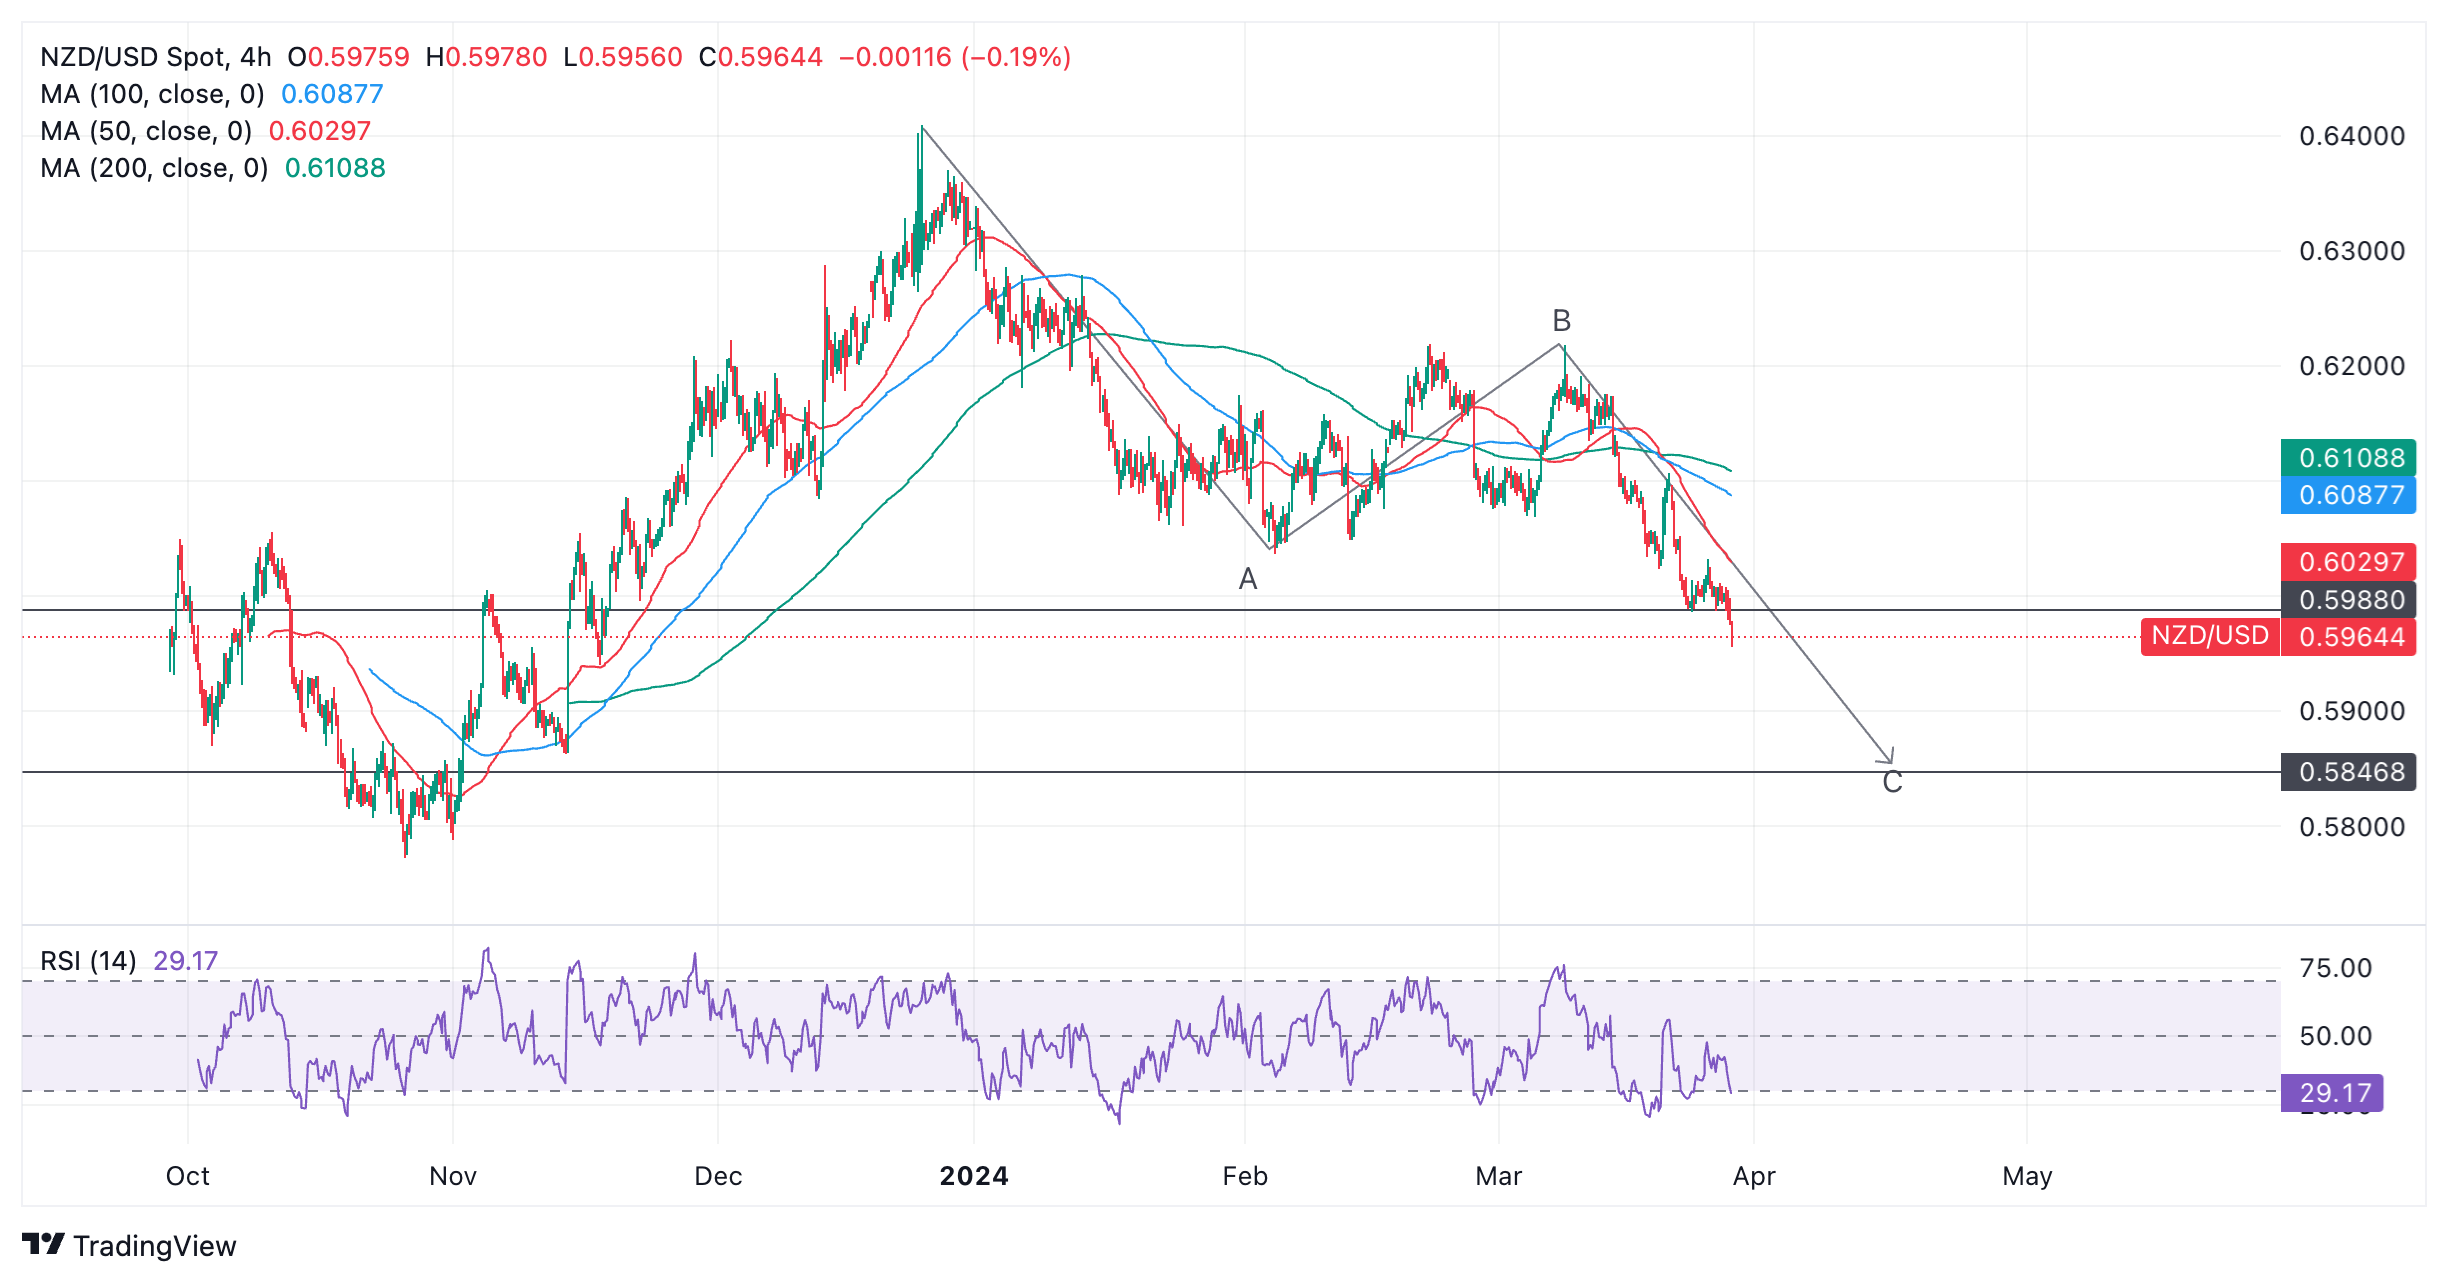
New Zealand Dollar versus US Dollar: 4-hour chart
Assuming the pattern unfolds as expected, the pair is likely to continue its decline until it reaches the target for the end of wave C, located at 0.5847.
NZD/USD has already broken below the conservative target for the pattern at 0.5988, measured as wave C ending at the 0.618 Fibonacci ratio of the length of wave A.
The pair is in a short-term downtrend which, according to the adage that “the trend is your friend,” is likely to continue.
The Relative Strength Index (RSI) momentum indicator is converging slightly with price, which is a mildly bullish significator. Convergence occurs when price falls to lower lows but RSI fails to reflect this. In the case of NZD/USD, the RSI is not as low as it was on March 19 even though the price is.
This could indicate the possibility of an upside correction occurring, although the dominant downtrend would still be expected to resume once the correction was complete.
RBNZ FAQs
The Reserve Bank of New Zealand (RBNZ) is the country’s central bank. Its economic objectives are achieving and maintaining price stability – achieved when inflation, measured by the Consumer Price Index (CPI), falls within the band of between 1% and 3% – and supporting maximum sustainable employment.
The Reserve Bank of New Zealand’s (RBNZ) Monetary Policy Committee (MPC) decides the appropriate level of the Official Cash Rate (OCR) according to its objectives. When inflation is above target, the bank will attempt to tame it by raising its key OCR, making it more expensive for households and businesses to borrow money and thus cooling the economy. Higher interest rates are generally positive for the New Zealand Dollar (NZD) as they lead to higher yields, making the country a more attractive place for investors. On the contrary, lower interest rates tend to weaken NZD.
Employment is important for the Reserve Bank of New Zealand (RBNZ) because a tight labor market can fuel inflation. The RBNZ’s goal of “maximum sustainable employment” is defined as the highest use of labor resources that can be sustained over time without creating an acceleration in inflation. “When employment is at its maximum sustainable level, there will be low and stable inflation. However, if employment is above the maximum sustainable level for too long, it will eventually cause prices to rise more and more quickly, requiring the MPC to raise interest rates to keep inflation under control,” the bank says.
In extreme situations, the Reserve Bank of New Zealand (RBNZ) can enact a monetary policy tool called Quantitative Easing. QE is the process by which the RBNZ prints local currency and uses it to buy assets – usually government or corporate bonds – from banks and other financial institutions with the aim to increase the domestic money supply and spur economic activity. QE usually results in a weaker New Zealand Dollar (NZD). QE is a last resort when simply lowering interest rates is unlikely to achieve the objectives of the central bank. The RBNZ used it during the Covid-19 pandemic.
Author

Joaquin Monfort
FXStreet
Joaquin Monfort is a financial writer and analyst with over 10 years experience writing about financial markets and alt data. He holds a degree in Anthropology from London University and a Diploma in Technical analysis.