Natural Gas rallies 2.5% with global supply issues ahead
- Natural Gas prices are trying to test the $1.90 resistance.
- A mix of geopolitical pressure, ESG, and unforeseen outages are the main drivers supporting prices.
- The US Dollar Index rallies to 104.00 after the BoJ delivered a dovish hike.
Natural Gas prices (XNG/USD) are rallying for a second consecutive day on Tuesday towards the key $1.90 resistance level. When overlooking the charts, gas prices have jumped actually near 20% in five days combined on all gas contracts with near 6% on XNG/USD alone. Traders are seeing a mixture of reasons to keep Gas prices supported, from the current geopolitical tensions in the Middle East and Ukraine to the push for green energy and ESG costs adding a premium to Gas prices. Adding to these, unforeseen outages in the US and Norway are also hitting production.
Meanwhile, the US Dollar is trading firmly in the green. The DXY US Dollar Index, which gauges the Greenback against a basket of currencies, rallies towards 104.00. The inflow in the Greenback comes after the Bank of Japan (BoJ) hiked interest rates for the first time in nearly two decades . However, the main takeaway for markets is that it was a one-and-done deal that was very well communicated.
Natural Gas is trading at $1.89 per MMBtu at the time of writing.
Natural Gas news and market movers: Supply issues ahead
- Nigerian gas exports have fallen substantially in March, lower by a third of normal, reports shipping data from Bloomberg.
- Shipments from Australia last week dropped due to severe weather and storms, making it unsafe for big Gas shipments to take place, according to Bloomberg.
- US LNG exports dropped nearly 10% last week, with the Freeport outage as the main driver. This adds to the several unscheduled maintenance in Norwegian Gas fields.
- Ukraine's attacks on Russian infrastructure are creating an issue for Gas flows towards Asia.
- The European Union has committed to asking importers of Russian LNG to reduce purchases this year, according to Energy Commissioner Kadri Simson.
Natural Gas Technical Analysis: Watch out for the squeeze
Natural Gas prices are starting to heal from their steep decline since February. With traders seeing a mixture of elements supporting prices, this makes the rally more healthy and less dependent on just one driver. Look for $2 on the topside, should more supply issues or a surge in demand occur.
On the upside, the key $2.00 level needs to be regained first. The next key level is the historic pivotal point at $2.12, which falls broadly in line with the 55-day Simple Moving Average (SMA) at $2.08. Should Gas prices pop up in that region, a broad area opens up with the first cap at the red descending trend line near $2.27.
On the downside, multi-year lows are still nearby with $1.65 as the first line in the sand. This year’s low at $1.60 needs to be kept an eye on as well. Once a new low for the year is printed, traders should look at $1.53 as the next supportive area.
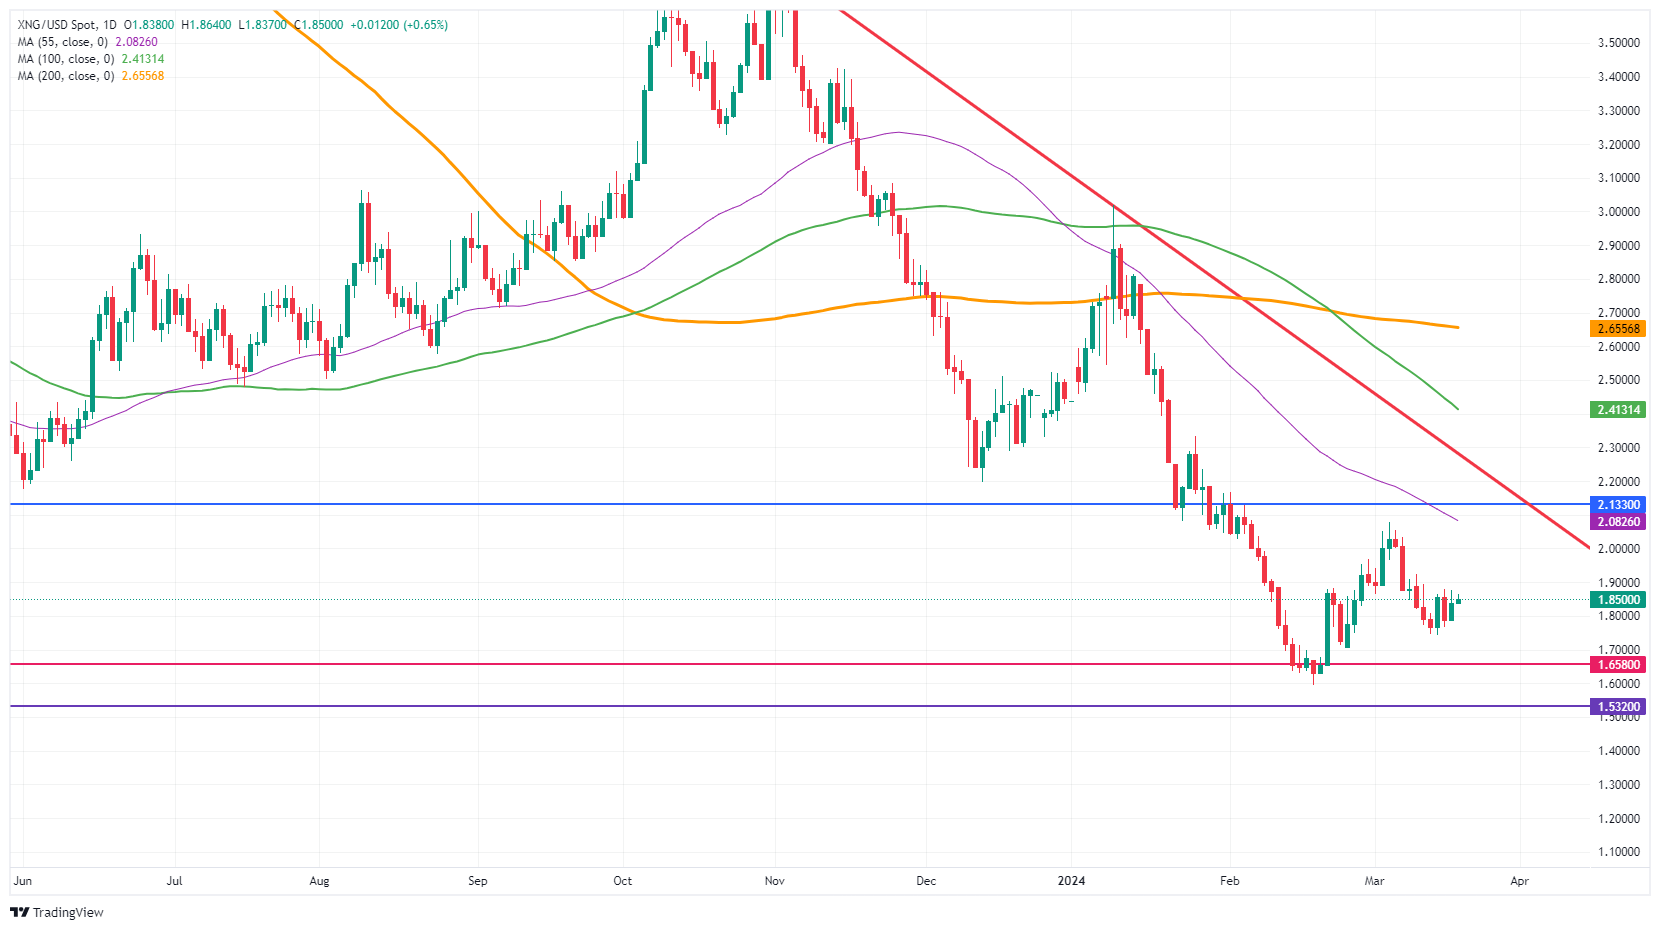
Natural Gas: Daily Chart
Natural Gas FAQs
Supply and demand dynamics are a key factor influencing Natural Gas prices, and are themselves influenced by global economic growth, industrial activity, population growth, production levels, and inventories. The weather impacts Natural Gas prices because more Gas is used during cold winters and hot summers for heating and cooling. Competition from other energy sources impacts prices as consumers may switch to cheaper sources. Geopolitical events are factors as exemplified by the war in Ukraine. Government policies relating to extraction, transportation, and environmental issues also impact prices.
The main economic release influencing Natural Gas prices is the weekly inventory bulletin from the Energy Information Administration (EIA), a US government agency that produces US gas market data. The EIA Gas bulletin usually comes out on Thursday at 14:30 GMT, a day after the EIA publishes its weekly Oil bulletin. Economic data from large consumers of Natural Gas can impact supply and demand, the largest of which include China, Germany and Japan. Natural Gas is primarily priced and traded in US Dollars, thus economic releases impacting the US Dollar are also factors.
The US Dollar is the world’s reserve currency and most commodities, including Natural Gas are priced and traded on international markets in US Dollars. As such, the value of the US Dollar is a factor in the price of Natural Gas, because if the Dollar strengthens it means less Dollars are required to buy the same volume of Gas (the price falls), and vice versa if USD strengthens.
Author

Filip Lagaart
FXStreet
Filip Lagaart is a former sales/trader with over 15 years of financial markets expertise under its belt.


