Natural Gas sinks over 1% with gas sellers hanging in the ropes
- Natural Gas prices were unable to break above $1.90 this week.
- Traders are throwing in the towel on bullish outlooks after European PMI data points to a subdued economic outlook.
- The US Dollar Index sprints higher with markets not buying into Fed’s soft-landing narrative.

Natural Gas (XNG/USD) trades roughly flat on Friday and it is set to close off the week with a small gain on the US side. However, on the other side of the Atlantic, the European Gas market is set to close this week in the red as elevated reserves and a lackluster economic outlook in Germany push demand for Gas further down.
Meanwhile, the DXY US Dollar Index, which gauges the US Dollar (USD) against a basket of six foreign currencies, is breaking above 104.00 on Friday. The mixture of China dropping the ball on its recovery, together with markets not buying into the three Fed rate cuts for 2024 is creating a cocktail in which the Greenback is winning twice. Investors do not see a reason for three rate cuts and a soft landing by the Fed because recent US economic numbers are still showing the economy is taking off, not landing, which questions the need for any rate cuts.
Natural Gas is trading at $1.83 per MMBtu at the time of writing.
Natural Gas news and market movers: European demand sinks further
- The UN is holding a summit on Friday to discuss a forced ceasefire in Gaza. This could be a trigger for more downside risk in Natural Gas should a ceasefire take place.
- Meanwhile in that same meeting, both China and Russia have opposed the proposal from the US.
- Russian Liquified Petroleum Gas prices are soaring as a result of the Ukraine drone strikes on several storage facilities.
- India has refused to take in Oil coming from Russia in order to comply with US sanctions, Bloomberg reported on Wednesday. A domino effect could be extended into Gas deliveries as well, which would mean a squeeze in prices in the region should Russian Gas be refused.
Natural Gas Technical Analysis: Consolidation towards next week
Natural Gas prices are still consolidating with a pennant formation on the Daily Chart, formed by lower highs and higher lows since mid-February. With both buyers and sellers being pushed toward each other, a breakout could be due at any time. Seeing the current lackluster energy demand out of Europe, with its storage units still above average, a turn to the downside looks more likely than an upside breakout.
On the upside, the key $2.00 level needs to be regained first. The next key mark is the historic pivotal point at $2.12, which falls broadly in line with the 55-day Simple Moving Average (SMA) at $2.05. Should Gas prices pop up in that region, a broad area opens up with the first cap at the red descending trendline near $2.27.
On the downside, multi-year lows are still nearby with $1.65 as the first line in the sand. This year’s low at $1.60 needs to be kept an eye on as well. Once a new low for the year is printed, traders should look at $1.53 as the next supportive area.
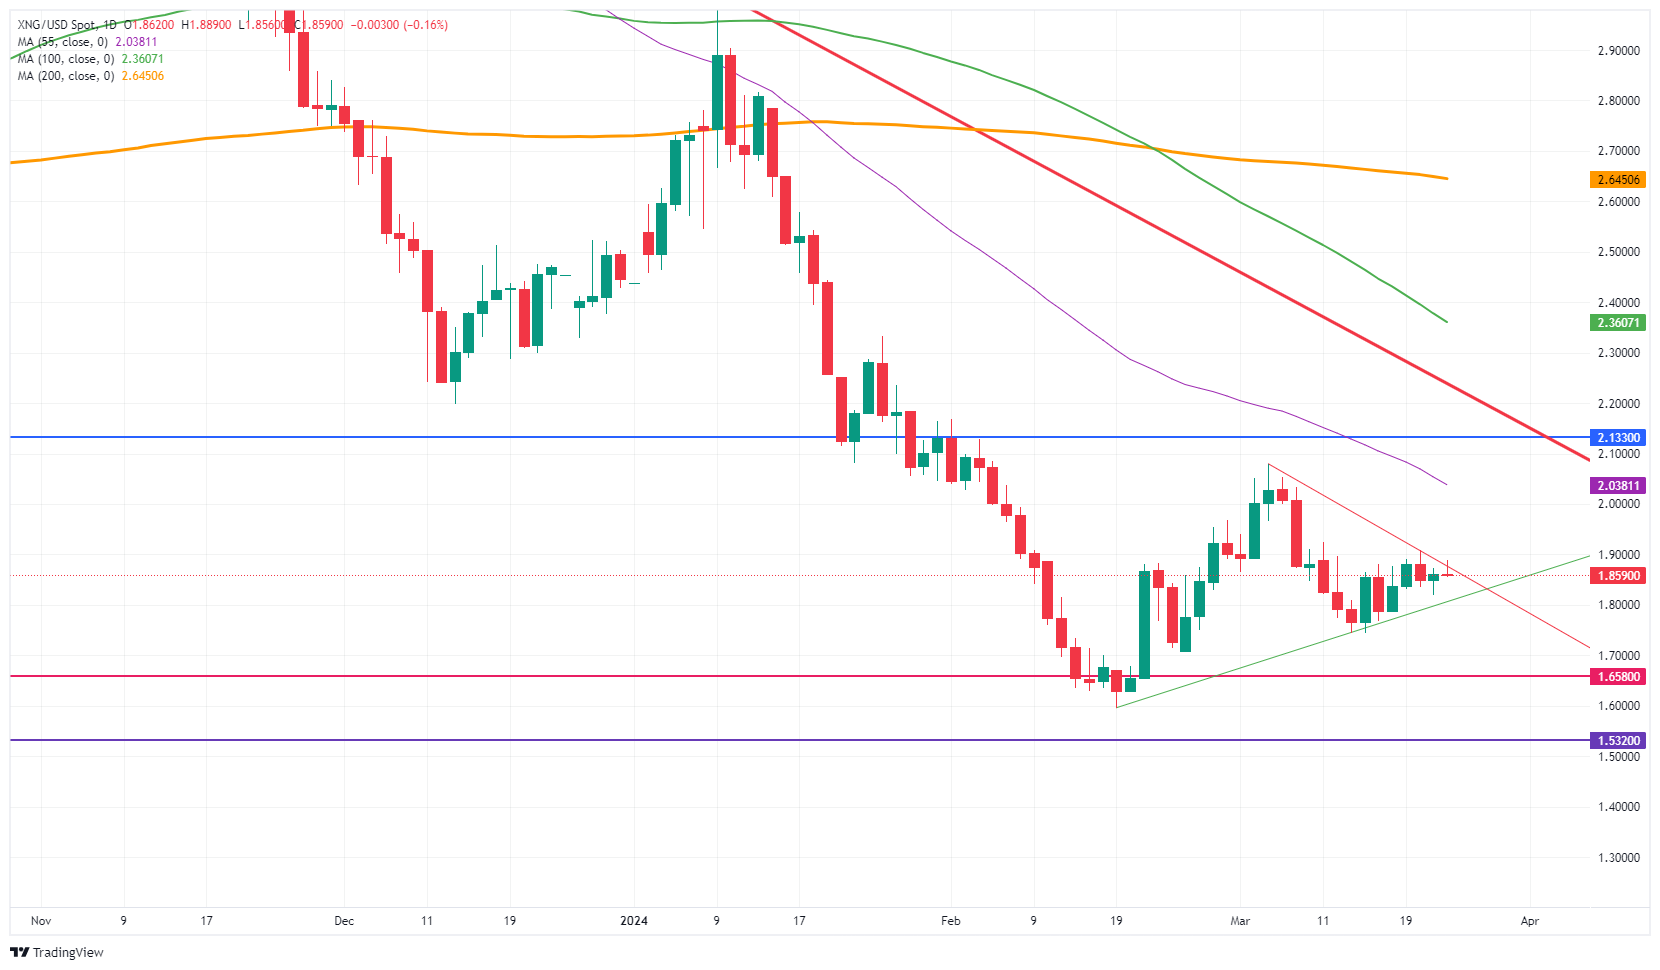
Natural Gas: Daily Chart
Natural Gas FAQs
Supply and demand dynamics are a key factor influencing Natural Gas prices, and are themselves influenced by global economic growth, industrial activity, population growth, production levels, and inventories. The weather impacts Natural Gas prices because more Gas is used during cold winters and hot summers for heating and cooling. Competition from other energy sources impacts prices as consumers may switch to cheaper sources. Geopolitical events are factors as exemplified by the war in Ukraine. Government policies relating to extraction, transportation, and environmental issues also impact prices.
The main economic release influencing Natural Gas prices is the weekly inventory bulletin from the Energy Information Administration (EIA), a US government agency that produces US gas market data. The EIA Gas bulletin usually comes out on Thursday at 14:30 GMT, a day after the EIA publishes its weekly Oil bulletin. Economic data from large consumers of Natural Gas can impact supply and demand, the largest of which include China, Germany and Japan. Natural Gas is primarily priced and traded in US Dollars, thus economic releases impacting the US Dollar are also factors.
The US Dollar is the world’s reserve currency and most commodities, including Natural Gas are priced and traded on international markets in US Dollars. As such, the value of the US Dollar is a factor in the price of Natural Gas, because if the Dollar strengthens it means less Dollars are required to buy the same volume of Gas (the price falls), and vice versa if USD strengthens.
Author

Filip Lagaart
FXStreet
Filip Lagaart is a former sales/trader with over 15 years of financial markets expertise under its belt.


