Natural Gas Price Analysis: XNG/USD retreats from 200-SMA within weekly rising wedge
- Natural Gas Price seesaws around one-week high as the key technical levels challenge further upside.
- 200-SMA prods XNG/USD buyers amid nearly overbought RSI conditions.
- Multiple supports, bullish MACD signals can put a floor under the Natural Gas Price even as rising wedge teases bears.

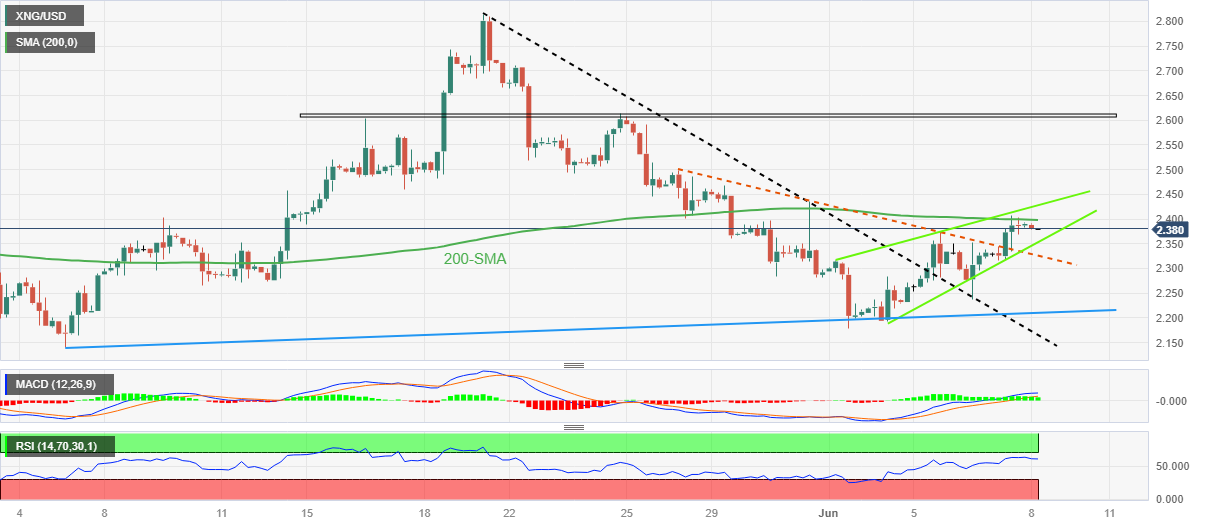
Natural Gas (XNG/USD) Price eases from the weekly top, paring intraday gains, as the energy instrument buyers fail to cross the 200-SMA amid early Thursday. With this, the XNG/USD prints mild losses of around $2.38 by the press time.
In doing so, the asset also eases within a one-week-old rising wedge bearish chart formation, currently between $2.35 and $2.43.
Apart from the 200-SMA and rising wedge, the nearly overbought RSI (14) line also teases the Natural Gas sellers.
However, the quote needs to break the $2.35 support to confirm the bearish chart pattern suggesting a theoretical fall toward $2.15.
During the anticipated downside, the previous resistance line from May 26, close to $2.32 at the latest, can act as an extra filter towards the north.
Following that, a two-month-old ascending trend line and resistance-turned-support from May 19, respectively near $2.20 and $2.16, can challenge the Natural Gas sellers before directing them to the $2.15.
On the contrary, an upside break of the 200-SMA hurdle of $2.40 needs validation from the stated wedge’s top line surrounding $2.43 to convince the XNG/USD bulls.
Even so, the late May swing high around $2.50 and a three-week-long horizontal resistance area around $2.60-61 can challenge the Natural Gas upside before welcoming the bulls.
Natural Gas Price: Four-hour chart
Trend: Limited downside expected
Author

Anil Panchal
FXStreet
Anil Panchal has nearly 15 years of experience in tracking financial markets. With a keen interest in macroeconomics, Anil aptly tracks global news/updates and stays well-informed about the global financial moves and their implications.