|

Natural Gas Price Analysis: Overbought RSI prods XNG/USD bulls below $2.80 key hurdle

  • Natural Gas price retreats from the highest levels in five weeks, pares the biggest daily jump in seven months.
  • Overbought RSI, 4.5-month-old horizontal area challenge XNG/USD bulls.
  • 100-DMA, April’s top can restrict pullback moves, Natural Gas buyers remain hopeful beyond $2.50.

Natural Gas (XNG/USD) price remains mildly offered near $2.71 as it pares the biggest daily gains since October 2022 amid early Friday in Europe. In doing so, the energy instrument eases from a five-week high amid the overbought RSI (14) conditions.

However, the XNG/USD’s ability to stay beyond the 100-DMA support, around $2.64 by the press time, keeps the buyers hopeful.

Even if the Natural Gas price drops below $2.64 DMA support, April’s top surrounding $2.57 and multiple levels marked since March, close to $2.50, could challenge the commodity bears before giving them control. It should be noted that a two-week-old ascending support line near $2.51 acts as an extra filter towards the south.

In that case, a quick fall towards the early May’s swing high of near $2.39 can’t be ruled out.

On the flip side, a nearly four-month-old horizontal resistance area surrounding $2.75-80 appears a tough nut to crack for Natural Gas buyers.

Though, a daily closing beyond $2.80 won’t hesitate to prod the March month high of $3.08. That said, the $3.00 psychological magnet may act as an intermediate halt between $2.80 and $3.08.

Overall, the Natural Gas price remains on the bull’s radar despite the latest retreat.

Natural Gas Price: Daily chart
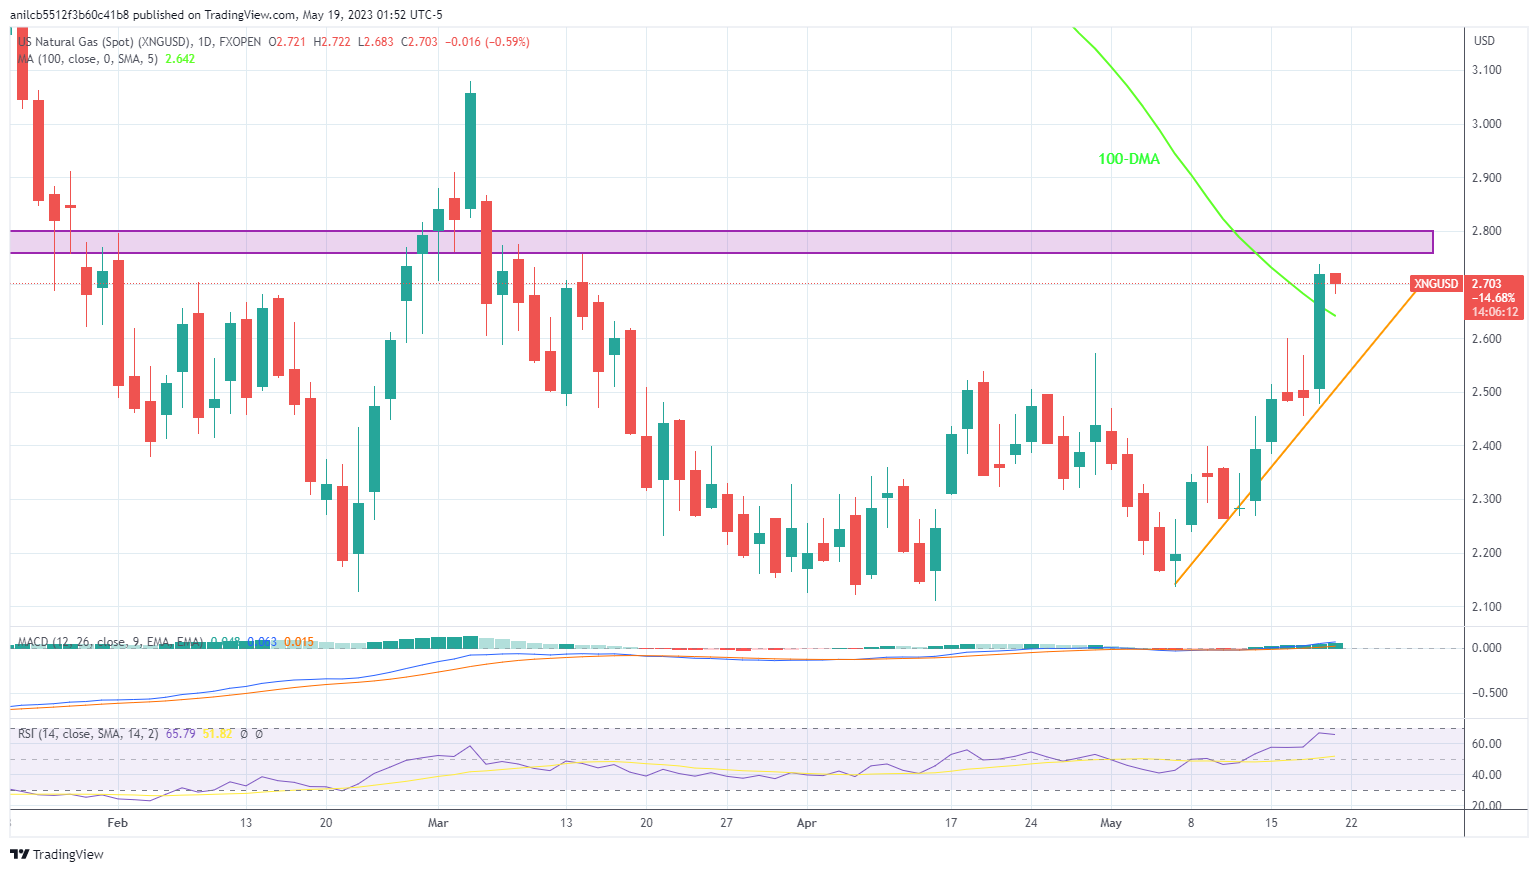
Trend: Further upside expected

Author

Anil Panchal

Anil Panchal

FXStreet

Anil Panchal has nearly 15 years of experience in tracking financial markets. With a keen interest in macroeconomics, Anil aptly tracks global news/updates and stays well-informed about the global financial moves and their implications.


More from Anil Panchal
Share:

Editor's Picks

GBP/USD clings to 1.3500 amid marginal losses

GBP/USD alternates gains with losses around the 1.3500 neighbourhood on Tuesday. Indeed, Cable struggles to further extend its incipient recovery in a context of continuous instability in the Middle East and modest gains in the Greenback.

EUR/USD alternates gains with losses near 1.1540

EUR/USD navigates a tight range near 1.1550 in the latter part of Tuesday’s NA session. The US Dollar’s vacillating price action accompanies the pair while market participants gear up for the crucial US inflation data due on Wednesday.

Gold loses the grip below $4,400

Gold retreats from its earlier tops and briefly revisited the $4,350 region per troy ounce on Tuesday. The yellow metal’s modest retracement follows lacklustre gains in the US Dollar and declining US Treasury yields across the curve, all amid steady uncertainty from the geopolitical landscape.

Shiba Inu Price Forecast: SHIB extends sell-off despite surging futures Open Interest
Shiba Inu (SHIB) maintains a bearish outlook on Tuesday, as it edges lower at $0.00000450. This marks the seventh day the meme coin has sustained a sell-off, weighed down by a weak technical structure. Shiba Inu derivatives continue to gain momentum, with perpetual futures Open Interest (OI) rising to 11.08 trillion SHIB on Tuesday, from 10.46 trillion the day before.
The inflation narrative is still way more important than the employment story
Core bonds sold off yesterday with the belly of the curve slightly underperforming in the US while European curves showed more of a bear flattening. Daily changes on the US curve varied between +4.7 bps (2-yr) and +6.4 bps (7-yr).
9-3: Is the Federal Reserve’s vote tally Warsh's new forward guidance?
The rate did not move. Neither did the statement, and that’s the more interesting fact. Set the July 29 Federal Open Market Committee (FOMC) statement beside the one issued on June 17, and the two documents are identical apart from a single verb and a paragraph at the bottom naming three dissenters.















