Natural Gas prices maintain uptrend in fourth straight day
- Natural Gas prices continue winning streak for fourth day.
- Israel has started its ground offensive in Rafah while ceasefire talks don’t bear fruits.
- The US Dollar Index ticks up on Tuesday after closing above 105.00.

Natural Gas (XNG/USD) retreated from its peak performance on Monday at $2.40 after markets were pricing in more risk premium on the heated-up situation in the Middle East. Although ceasefire talks are taking place again in Cairo, headlines on Monday showed that a deal is still far from near and Israel has started its ground offensive in Gaza’s southern city of Rafah. Meanwhile, Australian Liquified Natural Gas (LNG) exports are expected to drop substantially with Chevron’s Gorgon plant remaining offline for at least five weeks.
The US Dollar Index (DXY) is heading higher on Tuesday after Monday saw US Dollar bulls salvage it from a further slide by eking out a daily close above 105.00. That level is a line in the sand on the DXY chart in terms of more upside or downside.
Natural Gas is trading at $2.36 per MMBtu at the time of writing.
Natural Gas news and market movers: Australian hiccup in supply
- European Gas markets are whipsawing by pricing in and out a risk premium on local Gas prices while a lot of LNG volume is actually on its way to Europe. Therefore, any hiccup in supply disruption will not be felt in the first coming weeks, Bloomberg reports.
- Chevron had to reschedule several LNG deliveries for Asian buyers due to the outage at the Gorgon facility in Australia, traders reported to Reuters.
- ANZ Bank said in a note on Tuesday that a tight Asian market and Europe looking to further rebuild inventories could boost competition and prices in the Gas market, MT Newswires reported.
- PR Newswire reports that Karpowership and Brasilia’s Petrobras have signed a letter of intent to combine their respective expertise in the Natural Gas sectors. The agreement fits in the overall plan for Karpowership to further strengthen its access and relationship in the Brazilian Gas market.
Natural Gas Technical Analysis: Fresh high nearby
Natural Gas is on the breakout, that much is clear. Day by day the question is how this rally can withstand any profit-taking moments from traders that are in for the short ride and earn a few bucks. With the drift further away from substantial support levels, traders entering at elevated levels need to keep in mind that a correction can occur, and this will become more brutal as this rally sets sail towards $2.54 as the first nearby profit target.
On the upside, the January 25 high at $2.33 has been broken and the high of Monday at $2.40 is taking its place. Once through there, prices could steamroll towards the 200-day Simple Moving Average (SMA) at $2.54.
On the downside, a double belt is awaiting to provide support with the 100-day SMA at $2.09 and the pivotal level at $2.11 (low of April 14, 2023). Should this support above $2.00 not hold, then the ascending green trendline near $1.93 together with the 55-day SMA should avoid a further downturn.
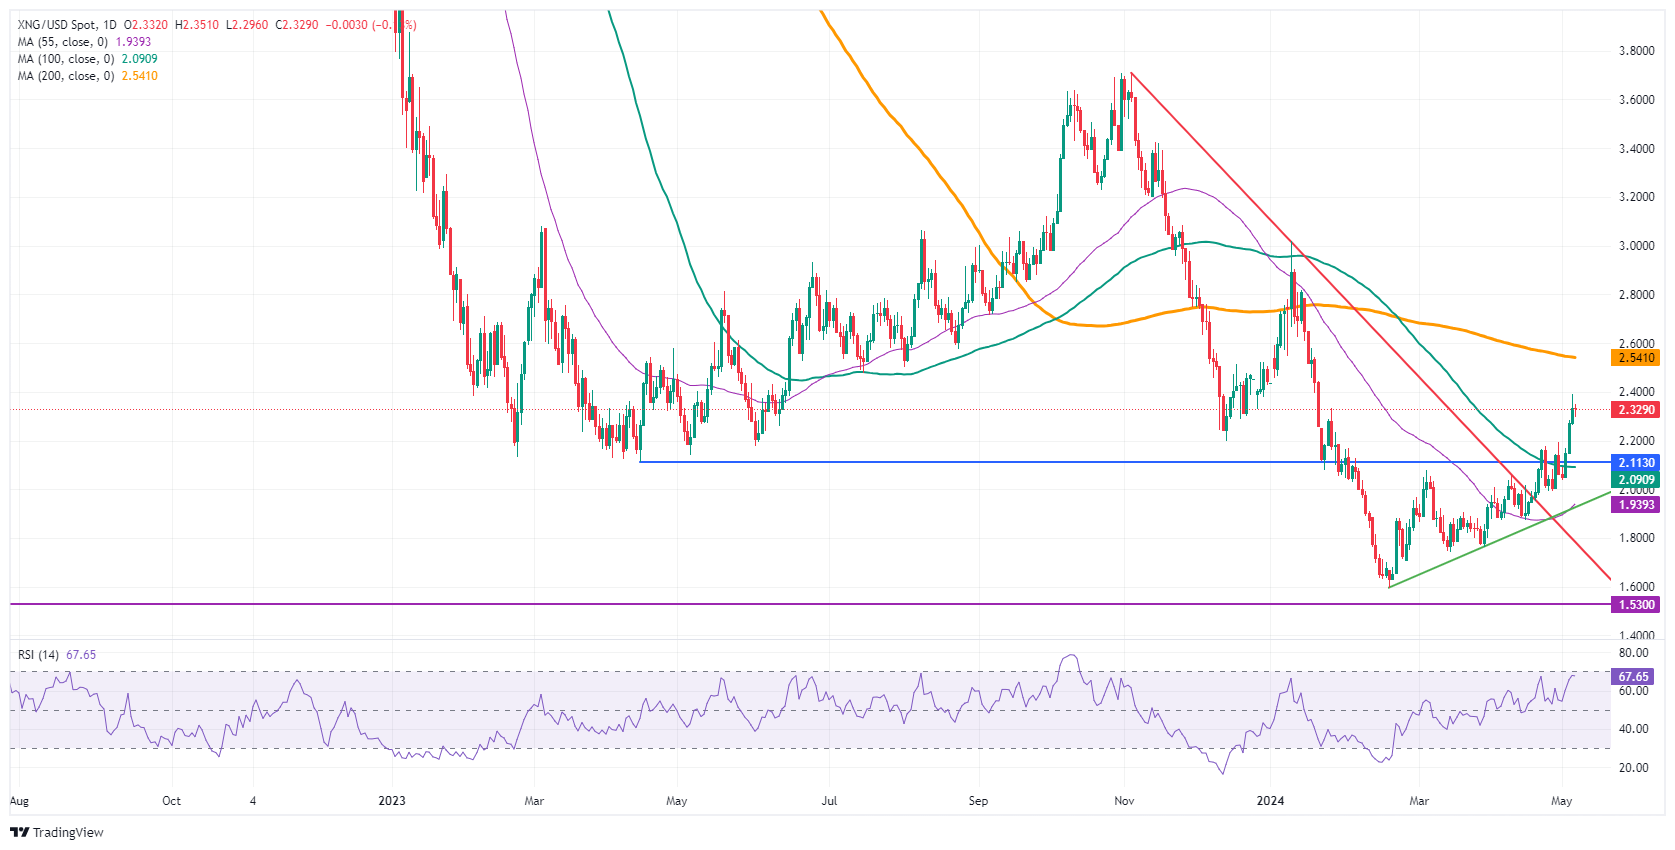
Natural Gas: Daily Chart
Natural Gas FAQs
Supply and demand dynamics are a key factor influencing Natural Gas prices, and are themselves influenced by global economic growth, industrial activity, population growth, production levels, and inventories. The weather impacts Natural Gas prices because more Gas is used during cold winters and hot summers for heating and cooling. Competition from other energy sources impacts prices as consumers may switch to cheaper sources. Geopolitical events are factors as exemplified by the war in Ukraine. Government policies relating to extraction, transportation, and environmental issues also impact prices.
The main economic release influencing Natural Gas prices is the weekly inventory bulletin from the Energy Information Administration (EIA), a US government agency that produces US gas market data. The EIA Gas bulletin usually comes out on Thursday at 14:30 GMT, a day after the EIA publishes its weekly Oil bulletin. Economic data from large consumers of Natural Gas can impact supply and demand, the largest of which include China, Germany and Japan. Natural Gas is primarily priced and traded in US Dollars, thus economic releases impacting the US Dollar are also factors.
The US Dollar is the world’s reserve currency and most commodities, including Natural Gas are priced and traded on international markets in US Dollars. As such, the value of the US Dollar is a factor in the price of Natural Gas, because if the Dollar strengthens it means less Dollars are required to buy the same volume of Gas (the price falls), and vice versa if USD strengthens.
Author

Filip Lagaart
FXStreet
Filip Lagaart is a former sales/trader with over 15 years of financial markets expertise under its belt.

















