Natural Gas jumps with GDP revision and uptick in Jobless Claims supporting demand
- Natural Gas prices turn in the green after wild ride lower earlier this week.
- A four day losing streak gets snapped.
- The US Dollar Index falls back in the red after printing a fresh March high.
Natural Gas (XNG/USD) jumps back above $1.81 and even briefly hit $1.82 in the US data release aftermath. The US numbers with the US Gross Domestic Product and jobless claims, triggered a turnaround in Thursday's market sentiment. Markets are seeing the final upward revision in GDP and specially in the Personal Consumption Expenditure component which contracted ahead of the PCE numbers on Friday.
The DXY US Dollar Index retreated and fell back in the red after breaking a fresh March high. The decline came as well with the US GDP upbeat surprise on performance and the contraction of PCE numbers. This pushed back against the hawkish comments from US Federal Reserve member Christopher Waller.
Natural Gas is trading at $1.82 per MMBtu at the time of writing.
Natural Gas news and market movers: Cuts back on the table
- A decline in China’s LNG inventories is becoming rather bad news for Gas prices, with Chinese buyers commenting to Bloomberg that they are awaiting a further decline in prices before considering refilling current drawdown levels.
- Japanese electricity generator Jera Co. is conducting planned outages at its gas-fueled plants in an effort to conserve liquefied natural gas after bad weather causes delays in LNG deliveries in the Tokyo Bay area.
- ANZ Bank revised its outlook for European gas prices to a further uprising with ongoing attacks between Russia and Ukraine on gas storage facilities creating the ideal situation for an energy crunch.
- The Energy Information Administration (EIA) has released its weekly gas storage numbers. Previous was a build of 7 billion cubic feet, wtih a draw of 27billion cubic feet for this week.
Natural Gas Technical Analysis: Watch out for shortterm euphoria
Natural Gas prices took a turn for the worse earlier this Thurdsay, sinking below $1.80 after a mixture of elements quickly made sentiment turn 180 degrees after the uprising on Tuesday. It was Fed’s Waller though who confirmed what markets were already thinking: those anticipated rate cuts are not going to come that quickly. This dampens hopes for a quick economic recovery and more growth potential, with thus demand being capped and even being revised to the downside. Further downside pressure is possible with the heating season ending and the summer lull in Gas markets ahead.
On the upside, the key $1.97 level needs to be regained first, with the 55-day Simple Moving Average (SMA) coming in as well. The next key mark is the historic pivotal point at $2.13. Should Gas prices pop up in that region, a broad area opens up with the first cap at the red descending trend line near $2.21.
On the downside, multi-year lows are still nearby with $1.65 as the first line in the sand. This year’s low at $1.60 needs to be kept an eye on as well. Once a new low for the year is printed, traders should look at $1.53 as the next supportive area.
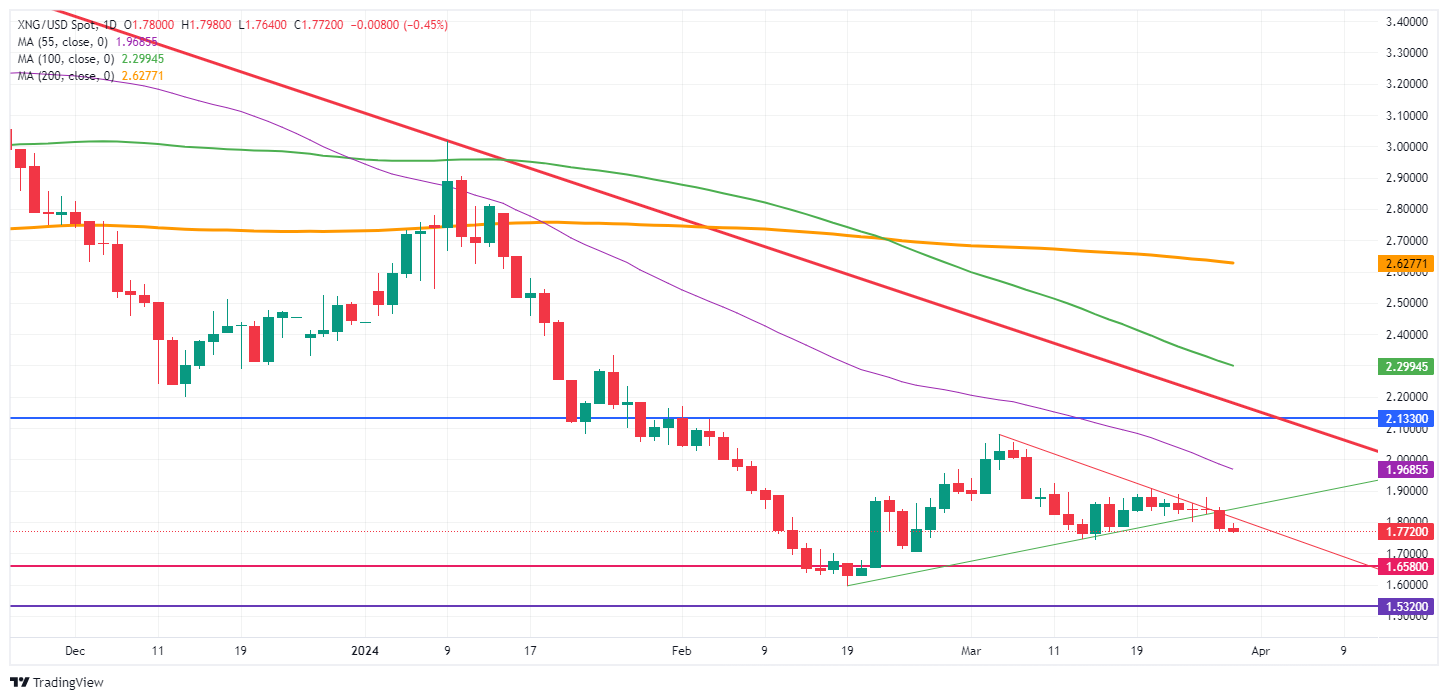
Natural Gas: Daily Chart
Natural Gas FAQs
Supply and demand dynamics are a key factor influencing Natural Gas prices, and are themselves influenced by global economic growth, industrial activity, population growth, production levels, and inventories. The weather impacts Natural Gas prices because more Gas is used during cold winters and hot summers for heating and cooling. Competition from other energy sources impacts prices as consumers may switch to cheaper sources. Geopolitical events are factors as exemplified by the war in Ukraine. Government policies relating to extraction, transportation, and environmental issues also impact prices.
The main economic release influencing Natural Gas prices is the weekly inventory bulletin from the Energy Information Administration (EIA), a US government agency that produces US gas market data. The EIA Gas bulletin usually comes out on Thursday at 14:30 GMT, a day after the EIA publishes its weekly Oil bulletin. Economic data from large consumers of Natural Gas can impact supply and demand, the largest of which include China, Germany and Japan. Natural Gas is primarily priced and traded in US Dollars, thus economic releases impacting the US Dollar are also factors.
The US Dollar is the world’s reserve currency and most commodities, including Natural Gas are priced and traded on international markets in US Dollars. As such, the value of the US Dollar is a factor in the price of Natural Gas, because if the Dollar strengthens it means less Dollars are required to buy the same volume of Gas (the price falls), and vice versa if USD strengthens.
Author

Filip Lagaart
FXStreet
Filip Lagaart is a former sales/trader with over 15 years of financial markets expertise under its belt.


