More uncertainty following record-breaking rally

There is a growing uncertainty in the stock market. Indexes are still very close to their new record highs, but stock prices basically go sideways. So, the question is – is this just a pause within an uptrend or some topping pattern before a more meaningful correction?
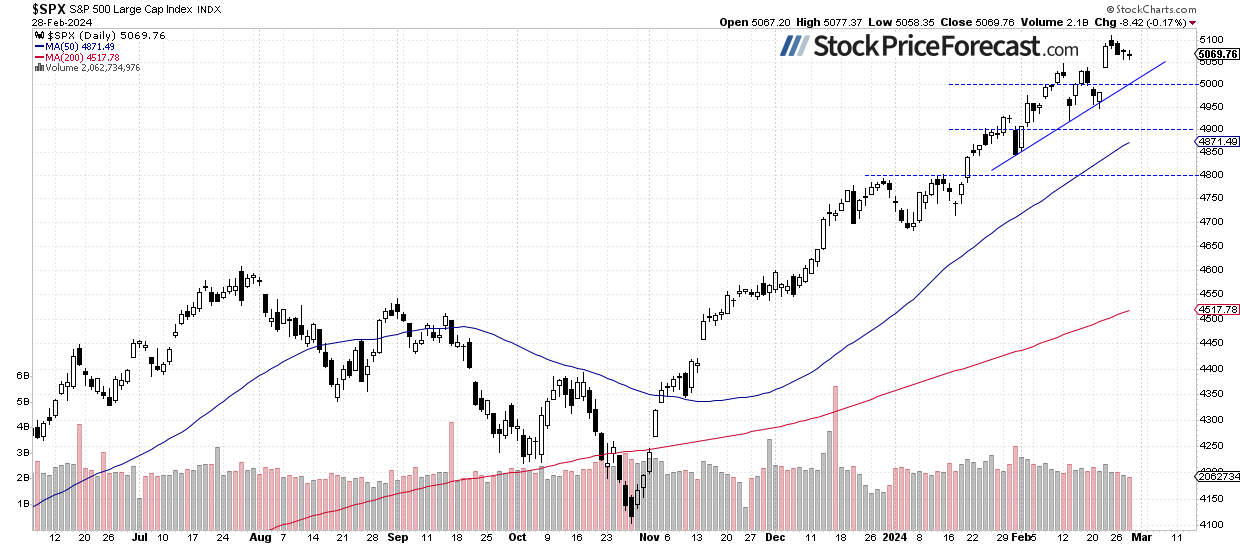
On Friday, the S&P 500 index reached a new record high of 5,111.06 before closing virtually flat. Since then, it has been trading sideways, and still above the 5,050 level. Yesterday, the index lost 0.17%. There have been no confirmed negative signals; however, one might consider the possibility of a trend reversal.
Recently, the stock market continued to rally, fueled by advances in a handful of tech sector stocks, but as I wrote on February 7, “We may have to deal with a correction or consolidation of several weeks of advances. With the season of quarterly earnings announcements coming to an end and a series of important economic data, profit taking may follow.” Despite late last week's rally, this still holds true. Nevertheless, such volatility complicates short-term market predictions.
This morning, the S&P 500 futures contract is 0.2% higher, likely leading to a neutral opening for the index. Today, we received Core PCE Price Index release, and it was as-expected at +0.4% m/m.
The investor sentiment has improved again this week; yesterday’s AAII Investor Sentiment Survey showed that 46.5% of individual investors are bullish, while only 21.3% of them are bearish. The AAII sentiment is a contrary indicator in the sense that highly bullish readings may suggest excessive complacency and a lack of fear in the market. Conversely, bearish readings are favorable for market upturns.
The S&P 500 index extends a short-term consolidation following last week’s rally, remaining well above a month-long upward trend line, as we can see on the daily chart.
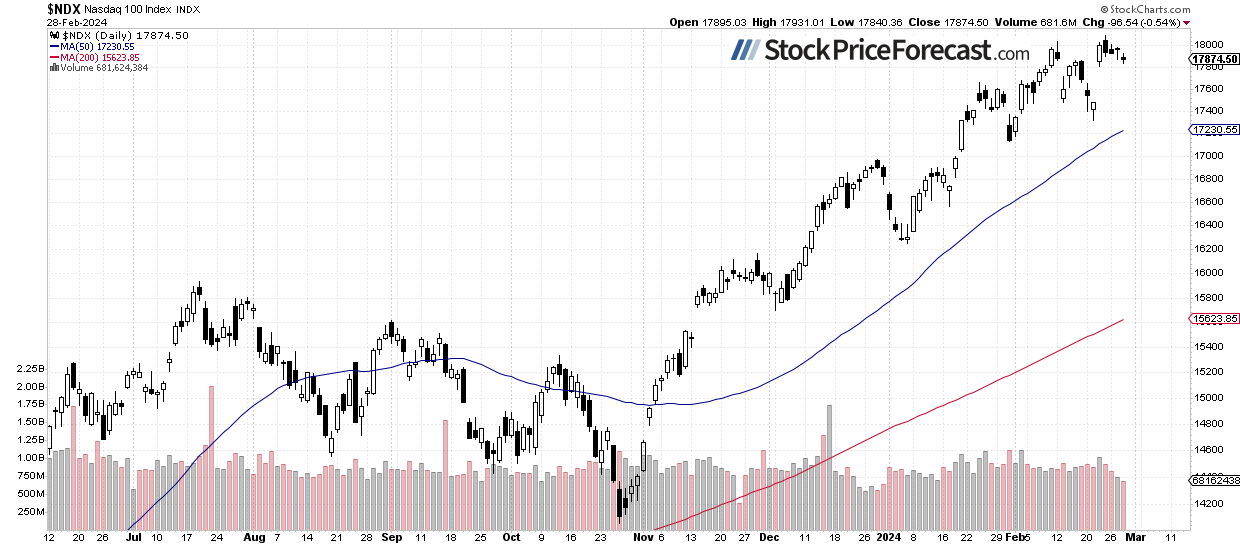
Nasdaq 100 – More uncertainty
On Friday, the technology-focused Nasdaq 100 index reached a new all-time high at 18,091.62 - 50 points above the previous high from February 12. However, the market failed to remain above 18,000, and this week, it has been trading sideways. Yesterday, it lost 0.54%, relatively weaker compared to the broad stock market.
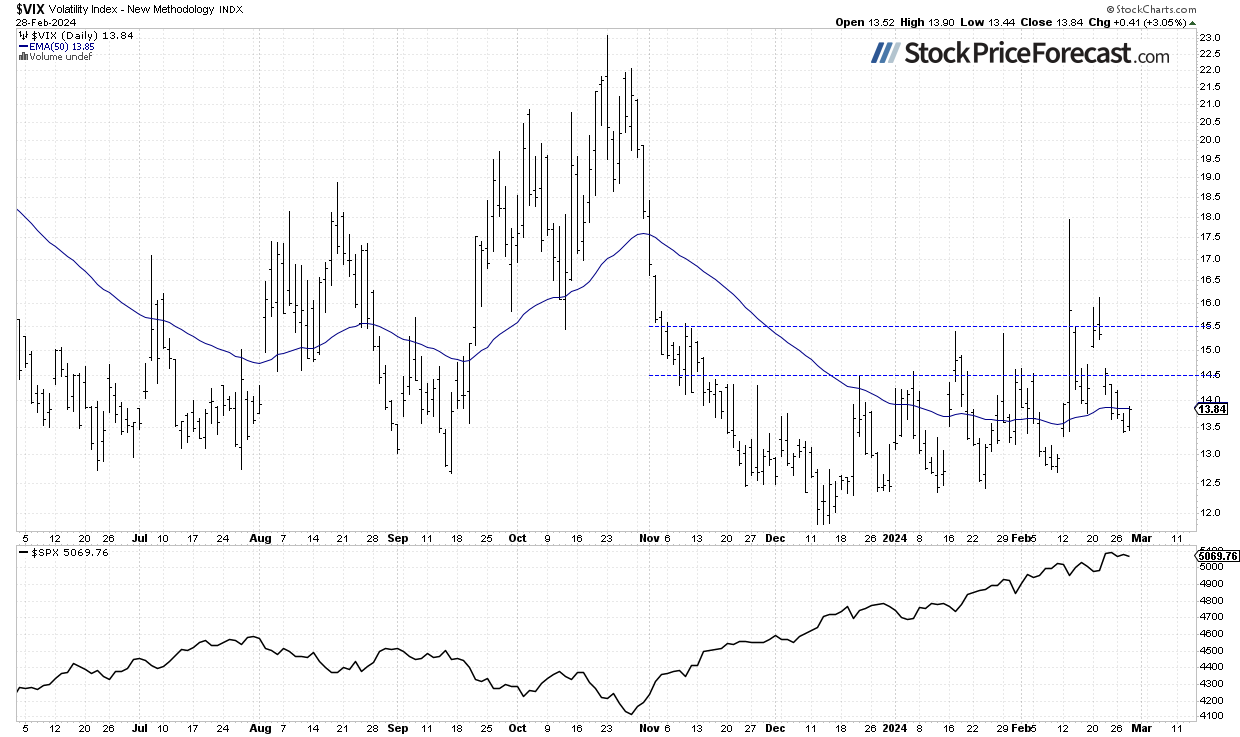
VIX remains below 14.00
The VIX index, also known as the fear gauge, is derived from option prices. Last Friday, it dropped below the 14 level. Despite weakness in stocks on Monday, it remained flat, and on Tuesday, it broke below the 13.50 level. Nonetheless, it is still notably above its recent lows from November to February, indicating that the market fears a downward correction at some point.
Historically, a dropping VIX indicates less fear in the market, and rising VIX accompanies stock market downturns. However, the lower the VIX, the higher the probability of the market’s downward reversal.
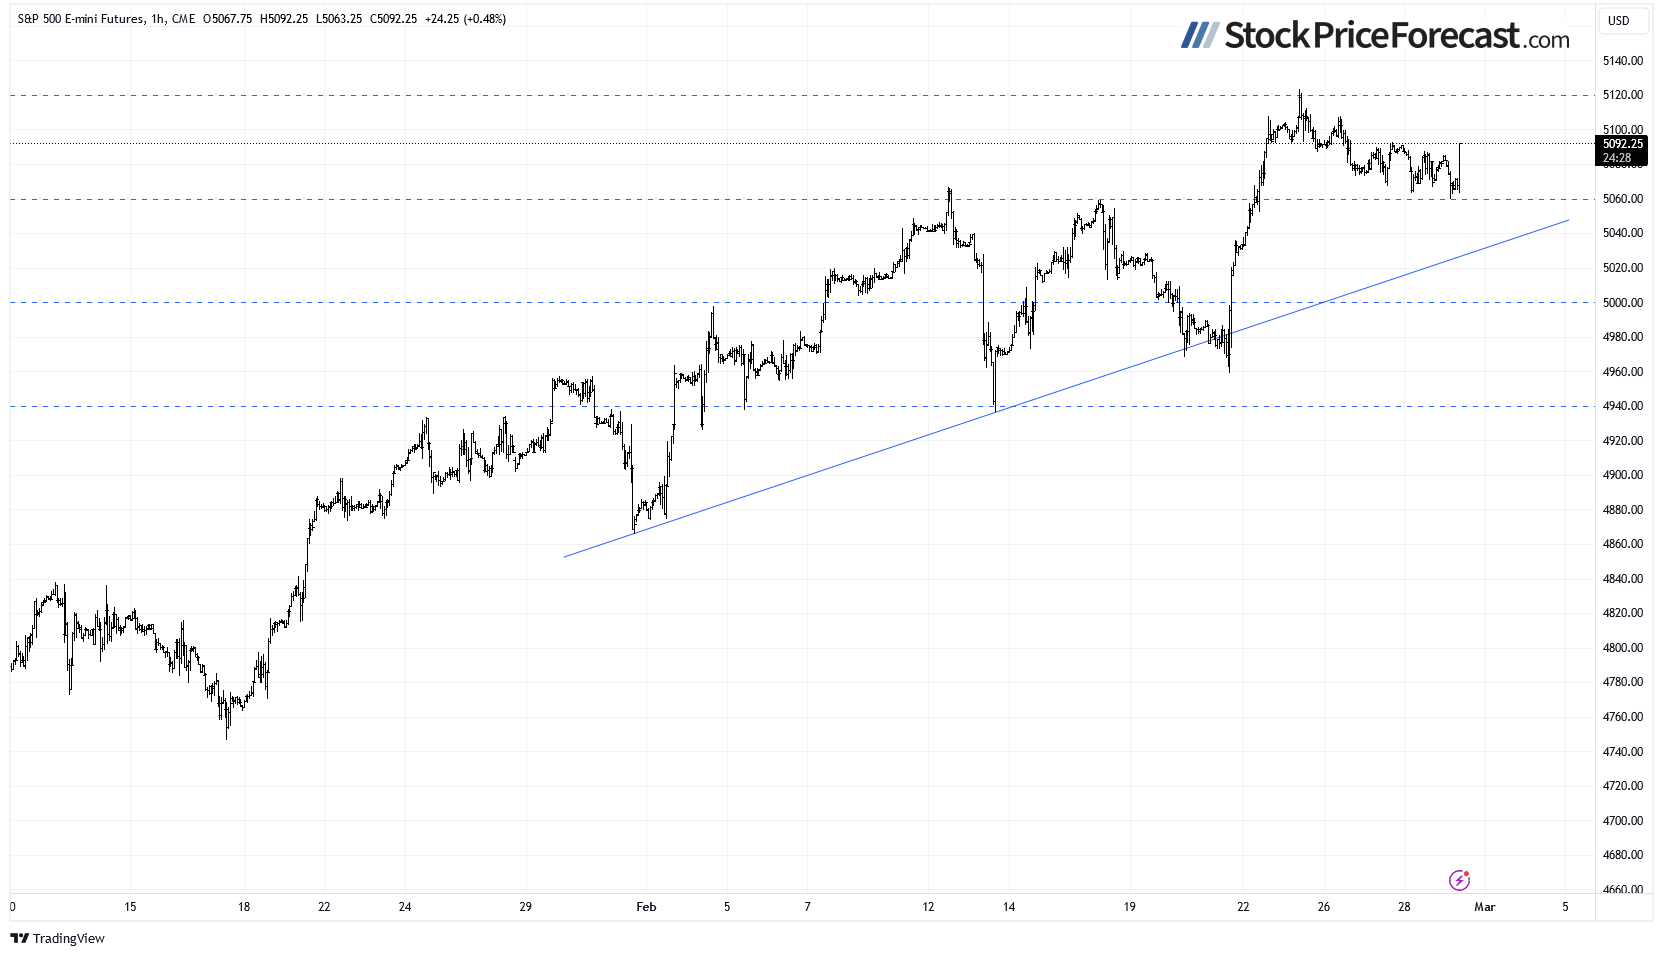
Futures contract going sideways
Let’s take a look at the hourly chart of the S&P 500 futures contract. On Friday, it reached a new record high of around 5,120, and this week, it’s trading below the 5,100 level. It still appears to be trading within a consolidation. The support level remains at 5,060, marked by the recent highs.
Conclusion
The recent trading action was very bullish, with some of the tech stocks rallying to new record highs, the S&P 500 index breaking above 5,100, and the Nasdaq 100 index testing the 18,000 mark. In my previous Tuesday's analysis, I noted that, “in the short term, the possibility of a downward correction cannot be overlooked. A quick glance at the chart reveals that the S&P 500 index has recently become more volatile.”. Indeed, the correction occurred pretty fast, with the inflation number contributing to the downturn. However, the market quickly retraced the decline in the following days, and last week, it rallied to a new record high on Nvidia news.
This week, the index retraced some of its rally from late last week. It remains to be seen whether this retracement marks the top, at least in the short term.
Today, the S&P 500 is likely to open slightly higher, extending a short-term consolidation. The most likely scenario remains an extended consolidation, as not all stocks are participating in the rally, and it's driven by a handful of AI-connected ones.
For now, my short-term outlook remains neutral.
Here’s the breakdown
-
The S&P 500 is expected to continue its short-term fluctuations amid mixed data, recent advances.
-
A longer consolidation phase may ensue, following an extended rally over the past months.
-
In my opinion, the short-term outlook is neutral.
Want free follow-ups to the above article and details not available to 99%+ investors? Sign up to our free newsletter today!
Want free follow-ups to the above article and details not available to 99%+ investors? Sign up to our free newsletter today!
Author

Paul Rejczak
Sunshine Profits
Paul Rejczak is a stock market strategist who has been known for the quality of his technical and fundamental analysis since the late nineties.


