MicroStrategy Stock Forecast: MSTR advances another 7% as Bitcoin sits near $71K
- MicroStrategy stock climbed more than 7% on Tuesday.
- That performance follows Monday's 4% gain.
- CEO Michael Saylor says the firm has acquired another 12,000 BTC.
- Daily chart shows MSTR has further room to run.

MicroStrategy stock (MSTR) gained another 7% on Tuesday, protecting shareholders from a worrying candlestick pattern at the start of the week. After surging as much as 15% on Monday, MSTR stock ended the day with a gain of 4% and a bearish Shooting Star Candlestick.
But Tuesday’s performance made certain that MicroStrategy is still in rally mode with shares ending the session up 7.35% at $1,593.35.
Bitcoin (BTC) dipped to $69K during the session before surging back to the area around $71K. The S&P 500, which will likely soon need to include MicroStrategy due to its market cap reaching $27 billion, gained 1.12%, while the NASDAQ did it one better at 1.53%.
MicroStrategy stock news
MicroStrategy has been rallying this week after its CEO, Michael Saylor, disclosed the purchase of approximately 12,000 Bitcoins last weekend. The company used $781.1 million from a recent sale of convertible senior notes and $40.6 million of its own cash.
The 12,000-odd Bitcoins were purchased during a two-week stretch between February 26 and March 10 and bring the company’s total ownership to 205,000 BTC. At the current price, this crypto portfolio is worth more than $14.7 billion.
It was acquired for $6.91 billion at an average purchase price of $33,706 per BTC. This makes MicroStrategy the single largest institutional holder of Bitcoin, when custodians like Coinbase (COIN), Binance and Blackrock (BLK) are excluded.
While MicroStrategy’s market cap is increasingly tied to the travails of the king of crypto, that might not be a bad place to be this year. Bitcoin will reach yet another halving event in less than two months. These events tend to drive the price of BTC higher, because each halving means Bitcoin miners receive half of the previous rewards per block, which makes it more scarce.
CoinLedger, a firm that does taxes for companies and individuals with large crypto exposure, released a report last week predicting that BTC will climb to $115K per coin six months after halving. If it did, MicroStrategy could easily double from here, even though the stock is already up nearly 160% this year alone.
Bitcoin, altcoins, stablecoins FAQs
What is Bitcoin?
Bitcoin is the largest cryptocurrency by market capitalization, a virtual currency designed to serve as money. This form of payment cannot be controlled by any one person, group, or entity, which eliminates the need for third-party participation during financial transactions.
What are altcoins?
Altcoins are any cryptocurrency apart from Bitcoin, but some also regard Ethereum as a non-altcoin because it is from these two cryptocurrencies that forking happens. If this is true, then Litecoin is the first altcoin, forked from the Bitcoin protocol and, therefore, an “improved” version of it.
What are stablecoins?
Stablecoins are cryptocurrencies designed to have a stable price, with their value backed by a reserve of the asset it represents. To achieve this, the value of any one stablecoin is pegged to a commodity or financial instrument, such as the US Dollar (USD), with its supply regulated by an algorithm or demand. The main goal of stablecoins is to provide an on/off-ramp for investors willing to trade and invest in cryptocurrencies. Stablecoins also allow investors to store value since cryptocurrencies, in general, are subject to volatility.
What is Bitcoin Dominance?
Bitcoin dominance is the ratio of Bitcoin's market capitalization to the total market capitalization of all cryptocurrencies combined. It provides a clear picture of Bitcoin’s interest among investors. A high BTC dominance typically happens before and during a bull run, in which investors resort to investing in relatively stable and high market capitalization cryptocurrency like Bitcoin. A drop in BTC dominance usually means that investors are moving their capital and/or profits to altcoins in a quest for higher returns, which usually triggers an explosion of altcoin rallies.
MicroStrategy stock forecast
MicroStrategy's daily stock chart below shows the bearish Shooting Star candlestick from Monday. That worrying candlestick was the product of an enormous spike then sent MSTR stock up some 15% on Monday only to close much lower for a 4% gain. Tuesday's Hammer candlestick, albeit not running to a new all-time high, shows that bulls haven't thrown in the towel just yet.
The Relative Strength Index (RSI) at 77, however, is quite worrying for shareholders itching to cash out.
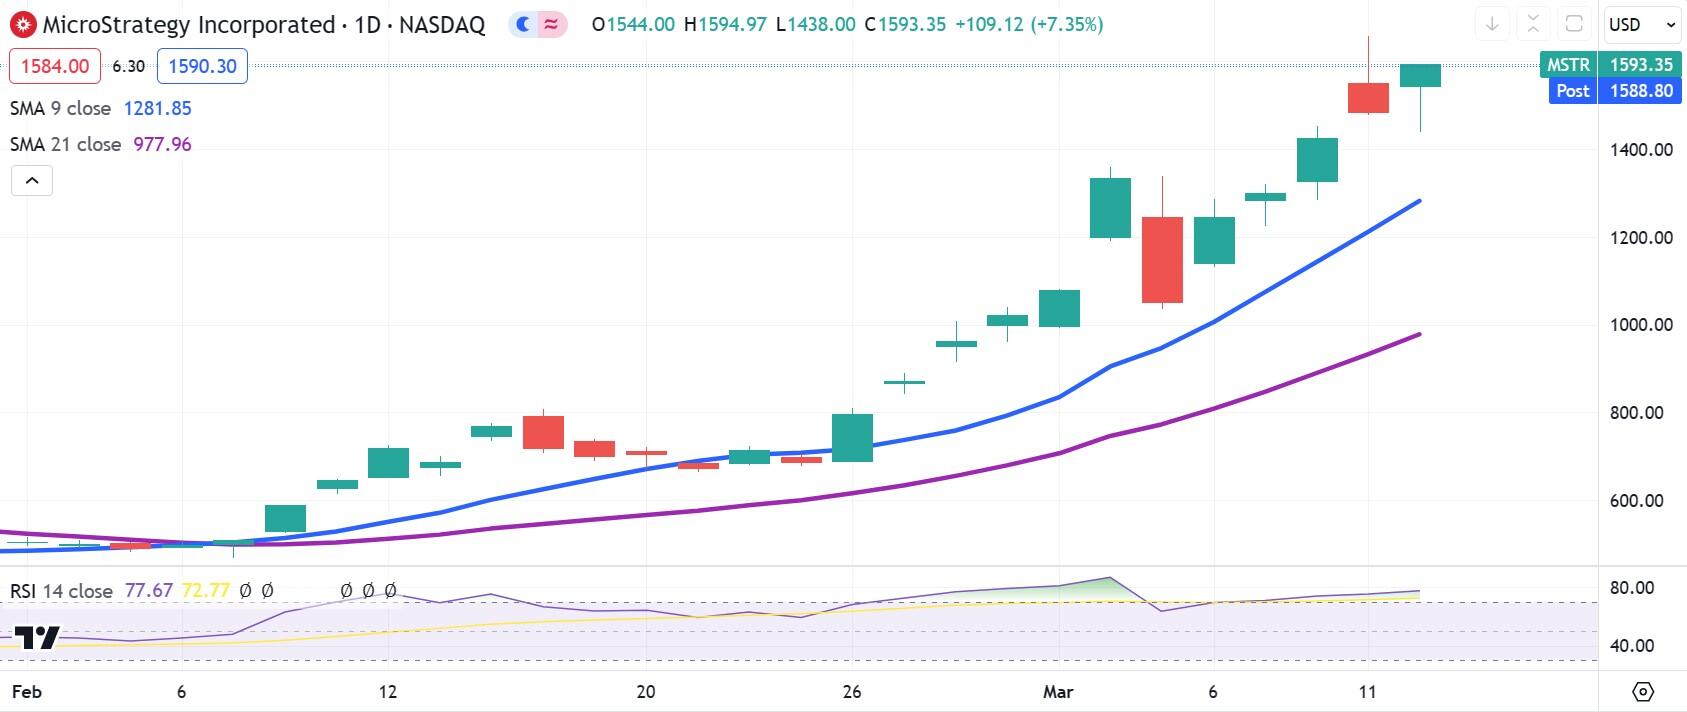
MSTR daily stock chart
The weekly chart below, on the other hand, shows just where MSTR stock may go next. This week the share price is basing off the 261.8% Fibonacci at $1,540. If the market continues to treat this level as support for the rest of the week, then traders need to hold on for the 361.8% Fibonacci at $1,960.
Still, the weekly chart's RSI of 89 seems heavily overbought, so a pullback or consolidation phase may need to surface soon enough.
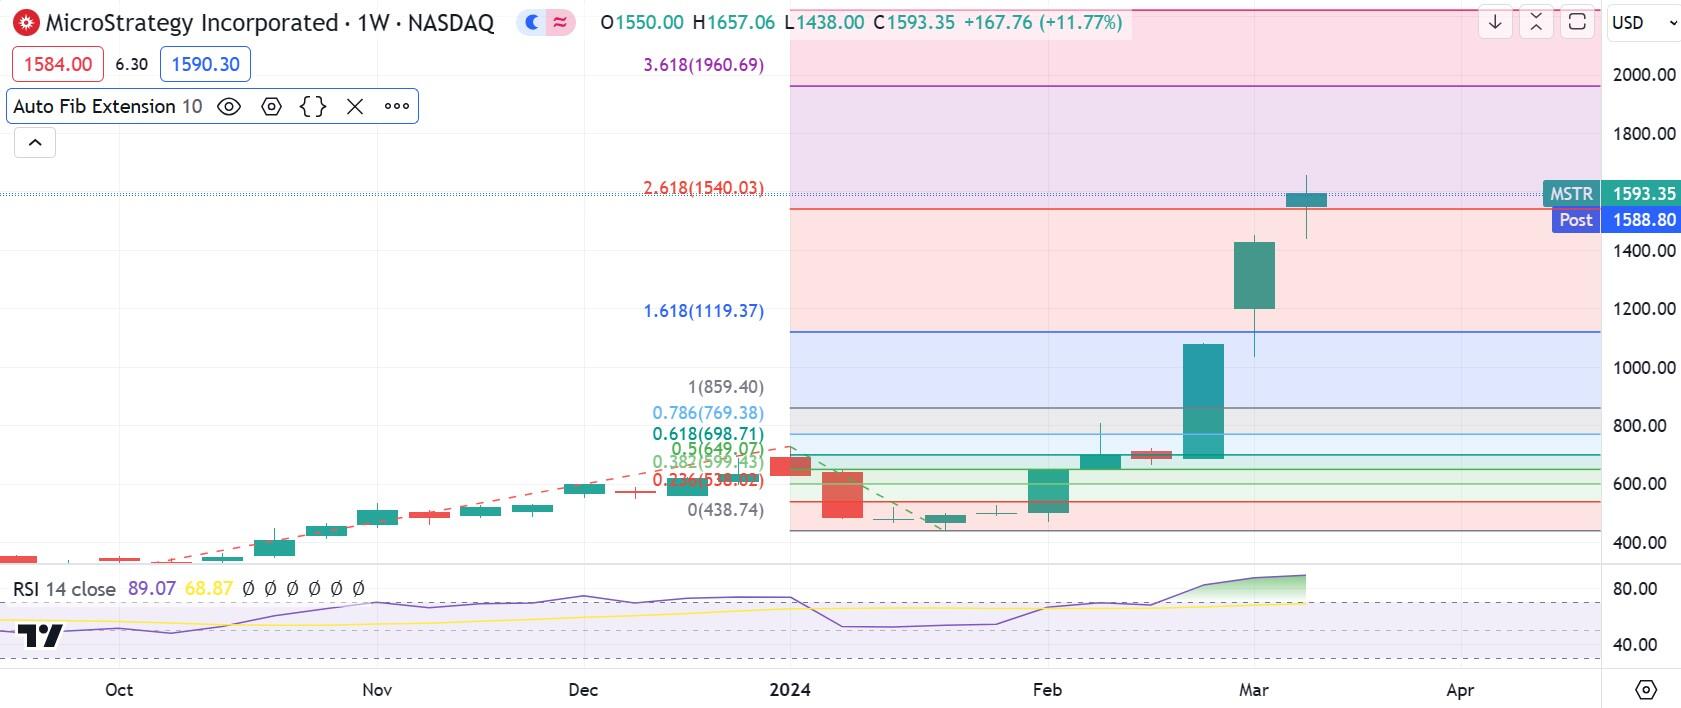
MSTR weekly stock chart
Premium
You have reached your limit of 3 free articles for this month.
Start your subscription and get access to all our original articles.
Author

Clay Webster
FXStreet
Clay Webster grew up in the US outside Buffalo, New York and Lancaster, Pennsylvania. He began investing after college following the 2008 financial crisis.