Microstrategy (MSTR Stock) correction nearly complete

As little as a year ago, Microstrategy wasn’t associated with the Crypto Currency sector. They were, and still are, a cloud based software company. However, investor focus changed in August of 2020 when they announced a major shift into Bitcoin investments. Let's take a look at what they do:
“Founded in 1989 by Michael J. Saylor, Sanju Bansal, and Thomas Spahr, the firm develops software to analyze internal and external data in order to make business decisions and to develop mobile apps. It is a public company headquartered in Tysons Corner, Virginia, in the Washington metropolitan area. Its primary business analytics competitors include SAP AG Business Objects, IBM Cognos, and Oracle Corporation’s BI Platform. Saylor is the CEO and chairman of the board.
In August 2020, MicroStrategy invested $250 million in Bitcoin as a treasury reserve asset, citing declining returns from cash, a weakening dollar, and other global macroeconomic factors. The company made several additional large purchases of Bitcoin later in the year; in total, the company spent over $1 billion purchasing Bitcoin in 2020 at an average purchase price of about $15,964 per Bitcoin. Michael J. Saylor is the main driver behind this strategy.”
Lets dig into the charts and see what they say!
Elliott Wave view monthly
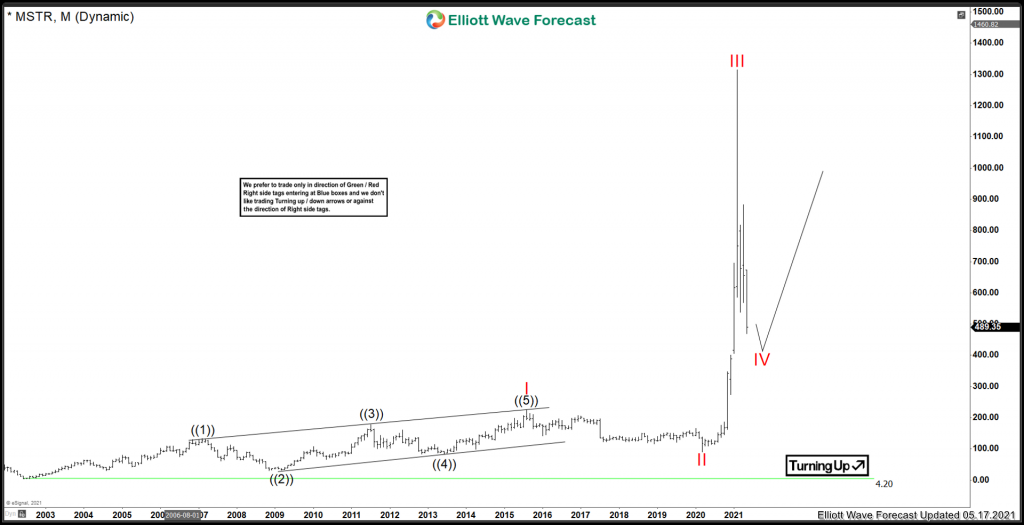
Microstrategy longer-term chart since the low in 2002 shows the bigger picture at play. The stock appears to have recently peaked in a wave III and now correcting in IV. There is still more upside favoured before correcting the whole cycle from the low in 2002 low as long as the red II low @ 90.00 remains intact. It is important to know the whole structure of an instrument in longer cycles before judging the shorter cycle view. Lets zoom into the daily view since the March 2020 low.
Elliott Wave view daily
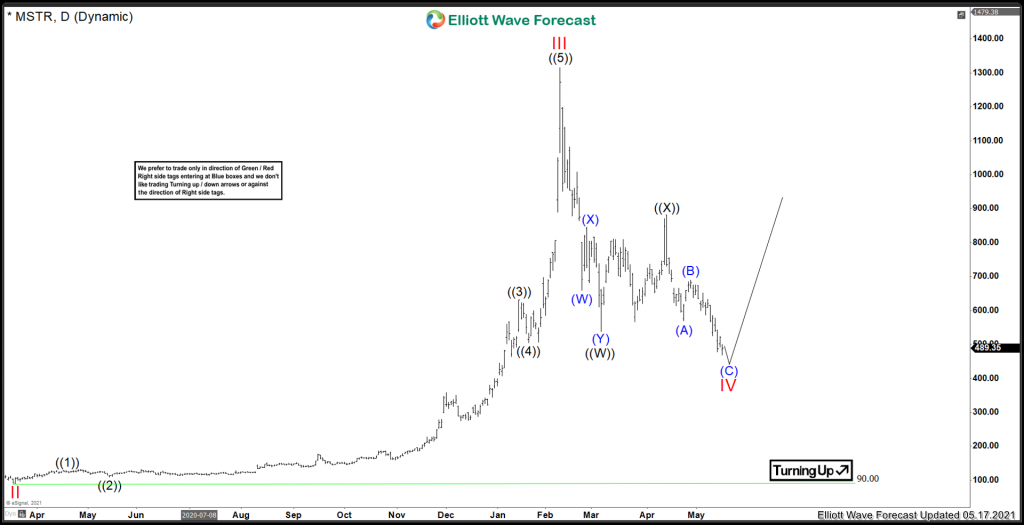
Microstrategy medium term view from the low in March 2020. There is enough evidence to support that the recent high at 1315 was a wave III peak. Prices are now favouring to be correcting the cycle from the March 2020 low. Normally, a 100% extreme area can be used to judge where a correction can end. In this case the price swings are too large to use that method. Taking Elliott Wave and momentum into consideration, prices appear to be close to forming a low. More minor downside can take place before resuming the rally higher.
In Conclusion, Red IV is still favoured to be underway. As long as prices remain above 90.00 level, further upside is favoured.
Premium
You have reached your limit of 3 free articles for this month.
Start your subscription and get access to all our original articles.
Author

Elliott Wave Forecast Team
ElliottWave-Forecast.com


