Mexican Peso recovers after strong Retail Sales data
- The Mexican Peso recovers after data shows a rise in Retail Sales in February.
- The Peso had weakened in a volatile sell-off after markets switch risk averse on geopolitical tensions.
- Israel purportedly retaliated against Iran, with explosions heard in the Iranian city of Isfahan.
- USD/MXN surged to just below 18.00 on the news but then retreats and settled in the 17.30s.

The Mexican Peso (MXN) is trading in the 17.20s on Friday after the release of Mexican Retail Sales data showed shoppers came out in force in February, their activity supporting a more positive outlook for the Mexican economy.
Retail Sales rose by 0.4% compared to January and were 3.0% higher than the previous year in February, data from the INEGI showed on Friday. The figures compare favourably to the previous month when Retail Sales fell by 0.4% MoM and 4.1% YoY.
The data boosts the outlook for the economy, but suggests inflation will remain high, forcing the Banxico to maintain interest rates at elevated levels. Higher interest rates are positive for the Peso as they attract greater capital inflows.
Mexican Peso roiled by a volatile 24 hours
The Mexican Peso is recovering after an extremely volatile 24 hours in which saw the currency depreciated by over five percentage points in some pairs as a result of a mass exodus to safety.
News reports of an Israeli attack on Iran in retaliation for the April 13 drone attacks with explosions heard in the Iranian city of Isfahan where a military base is located, led to mass movement of capital to safe-haven currencies and exodus from risky assets such as the Peso, according to Reuters.
Markets reacted in an extreme way with investors piling into safe-haven assets such as Gold, the Japanese Yen (JPY), the Swiss Franc (CHF) and the US Dollar (USD). At the other end of the spectrum, currencies perceived as “risky” such as the Mexican Peso and the South African Rand got hammered.
Fedspeak also stokes Mexican Peso weakness against USD
The Mexican Peso’s sharp decline was not caused solely by the flight to safety from Israel’s retaliation, but in the case of its most traded pair, the USD/MXN, also because of the impact of more hawkish talk from rate-setters at the US Federal Reserve (Fed).
From expecting three 0.25% interest rate cuts from the Fed in 2024, the mood music now coming out of the US central bank suggests officials only expect one, possibly two, and in extreme cases no cuts to the Fed Funds Rate materializing this year.
Atlanta Fed President Raphael Bostic said on Thursday that US inflation is returning to the Fed’s 2.0% target at a slower pace than anticipated and that interest-rate cuts are likely – but not until year-end.
New York Fed President John Williams went further, saying he didn’t feel an urgency to cut interest rates and that monetary policy is in a good place.
US data also arguably supported the notion that borrowing costs are where they should be due to inflationary tendencies.
The Index of Prices Paid component of the Philadelphia Fed Manufacturing Survey – a regional barometer of inflation – surged unexpectedly to 23.00 (prior 3.7) in April, suggesting price pressures remain very much alive and kicking.
A steady reading for Initial Jobless Claims further reinforced the view that the US labor market is tight and likely to continue to stoke inflation.
Since higher inflation will require the maintenance of higher interest rates to combat it, the odds of the Federal Reserve cutting interest rates keep falling. This is positive for the US Dollar since higher interest rates tend to increase foreign capital inflows.
On the data front, Mexican Peso traders will be keeping an eye on Mexican Retail Sales data out at 12:00 GMT on Friday, although the likelihood of it moving the dial for the Peso remains low.
Technical Analysis: USD/MXN surges
USD/MXN – the value of one US Dollar in Mexican Pesos – broke out of the bullish Pennant price pattern it had formed on the 4-hour chart, surged up to the target for the pattern at roughly 17.43, and then surpassed it.
The breakout higher now suggests a bullish reversal has occurred in both the short and intermediate term trends. This now favors long positions over those time horizons (up to 6 months).
USD/MXN 4-hour Chart
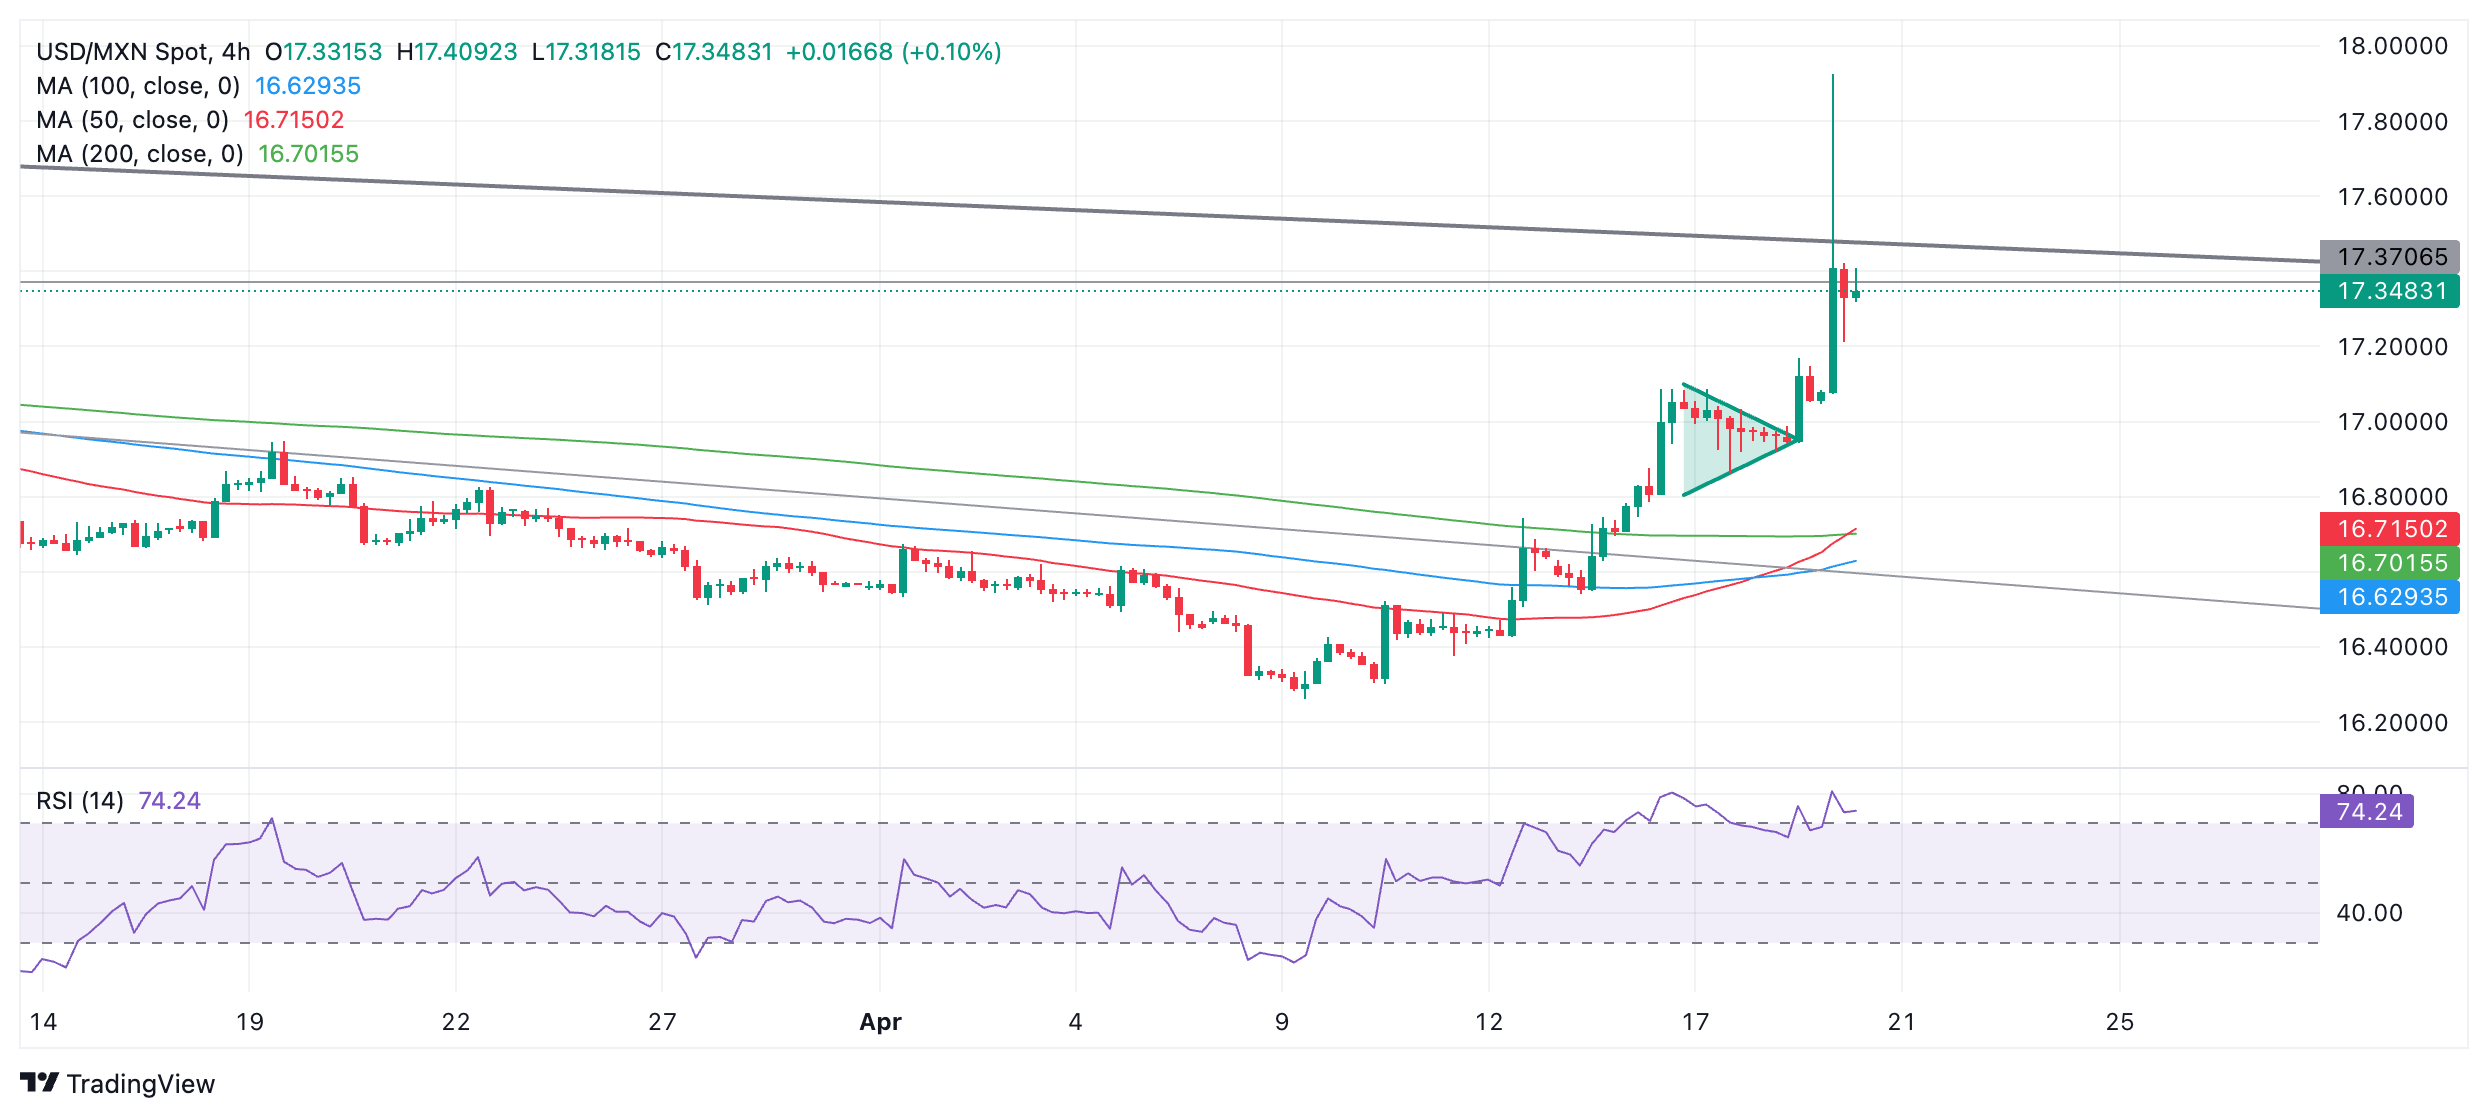
USD/MXN pierced but ultimately failed to hold above a major trendline for the long-term downtrend, suggesting caution should be exercised before becoming uber-bullish over the long term.
That said, peaks and troughs keep rising on the 4-hour chart and, as the old adage goes, “The trend is your friend until the bend at the end,” so more upside is the default expectation in the near term.
The Relative Strength Index (RSI) has risen into overbought territory, suggesting an increasing risk of a pullback. However, RSI is often overbought for long periods of time in strongly trending markets. Nevertheless, traders are advised not to add to their long positions and wait for a pullback into neutral territory before reloading their longs.
A decisive break above the trendline at roughly 17.45 would provide reconfirmation of further upside, and activate an upside target at roughly 18.15.
A decisive break would be one characterized by a longer-than-average green daily candlestick that pierces above the trendline and closes near its high, or three green candlesticks in a row that pierce above the level.
If a pullback persists, support from the 200-day Simple Moving Average (SMA) at 17.17 is likely to provide a foothold for the backsliding price.
Economic Indicator
Retail Sales (YoY)
The Retail Sales released by INEGI measures the total receipts of retail stores. Monthly percent changes reflect the rate of changes of such sales. Changes in retail sales are widely followed as an indicator of consumer spending. Generally speaking, a high reading is seen as positive or bullish for the Mexican peso, while a low reading is seen as negative or bearish.
Read more.Author

Joaquin Monfort
FXStreet
Joaquin Monfort is a financial writer and analyst with over 10 years experience writing about financial markets and alt data. He holds a degree in Anthropology from London University and a Diploma in Technical analysis.















