Mexican Peso weakens against USD after release of US GDP data
- The Mexican Peso falls versus the US Dollar after the release of US Q1 GDP data.
- The Peso had already been weakening as market sentiment turned negative.
- Equities are down after Meta shares tumbled on Q2 guidance, rising Middle East tensions.
- The Peso loses ground against the Euro after Bund yields spike on Bundesbank president’s comments.
The Mexican Peso (MXN) trades lower by over half a percent against the US Dollar (USD) in the 17.20s after the release of preliminary US Gross Domestic Product data from the US Bureau of Economic Analysis. The data shows the US economy grew at a 1.7% annualized pace in Q1. This compares with the 3.4% of the previous quarter and is below the 2.5% expected. The GDP Price Index data, a measure of inflation that is released together with GDP, shows strong underlying price growth which catalyses a rebound in the Greenback across the board.
Mexican Peso falls against USD despite lower-than-expected US GDP
Despite the lower-than-expected annualized GDP data the US Dollar rises against the Mexican Peso following the release of Q1 GDP data. The reason could be that the preliminary Gross Domestic Product Price Index for Q1 – a gauge of inflation – came out at 3.1% which was substantially higher than the 1.7% of the previous quarter.
The Price Index data suggests stubbornly high inflation in the US economy that will probably lead the Federal Reserve (Fed) to keep interest rates higher for longer. Higher interest rates are in turn positive for USD since they attract great inflows of foreign capital. After the release of the data, the CME FedWatch Tool, a market-based gauge of future interest rate changes calculated the probability of the next Fed rate cut as being in September.
In addition, higher-than-expected Core Personal Consumption Expenditures in Q1, which is also a measure of inflation, showed a 3.7% rise QoQ compared to estimates of 3.4% and a previous reading of 2.0%.
The Peso had already been weakening amid a souring market sentiment and rising geopolitical tensions given its sensitivity to risk.
Mexican Peso weakens versus Euro
The Mexican Peso is down against the Euro on Thursday after benchmark German Bund yields spiked higher following comments from the President of the Bundesbank and European Central Bank (ECB) governing council member, Joachim Nagel.
Nagel said, on Wednesday, that although the ECB would still probably go ahead with a rate cut in June, further cuts down the road might not follow.
Continued stubborn wage-related inflation in the services sector was the main bugbear, said Nagel, who added that until inflation had come down in a sustainable manner the ECB could not commit to a “pre-commit to a particular rate path.”
Technical Analysis: USD/MXN corrects in short-term downtrend
USD/MXN corrects in its short-term downtrend but more weakness is probably eventually on the cards.
USD/MXN 4-hour Chart
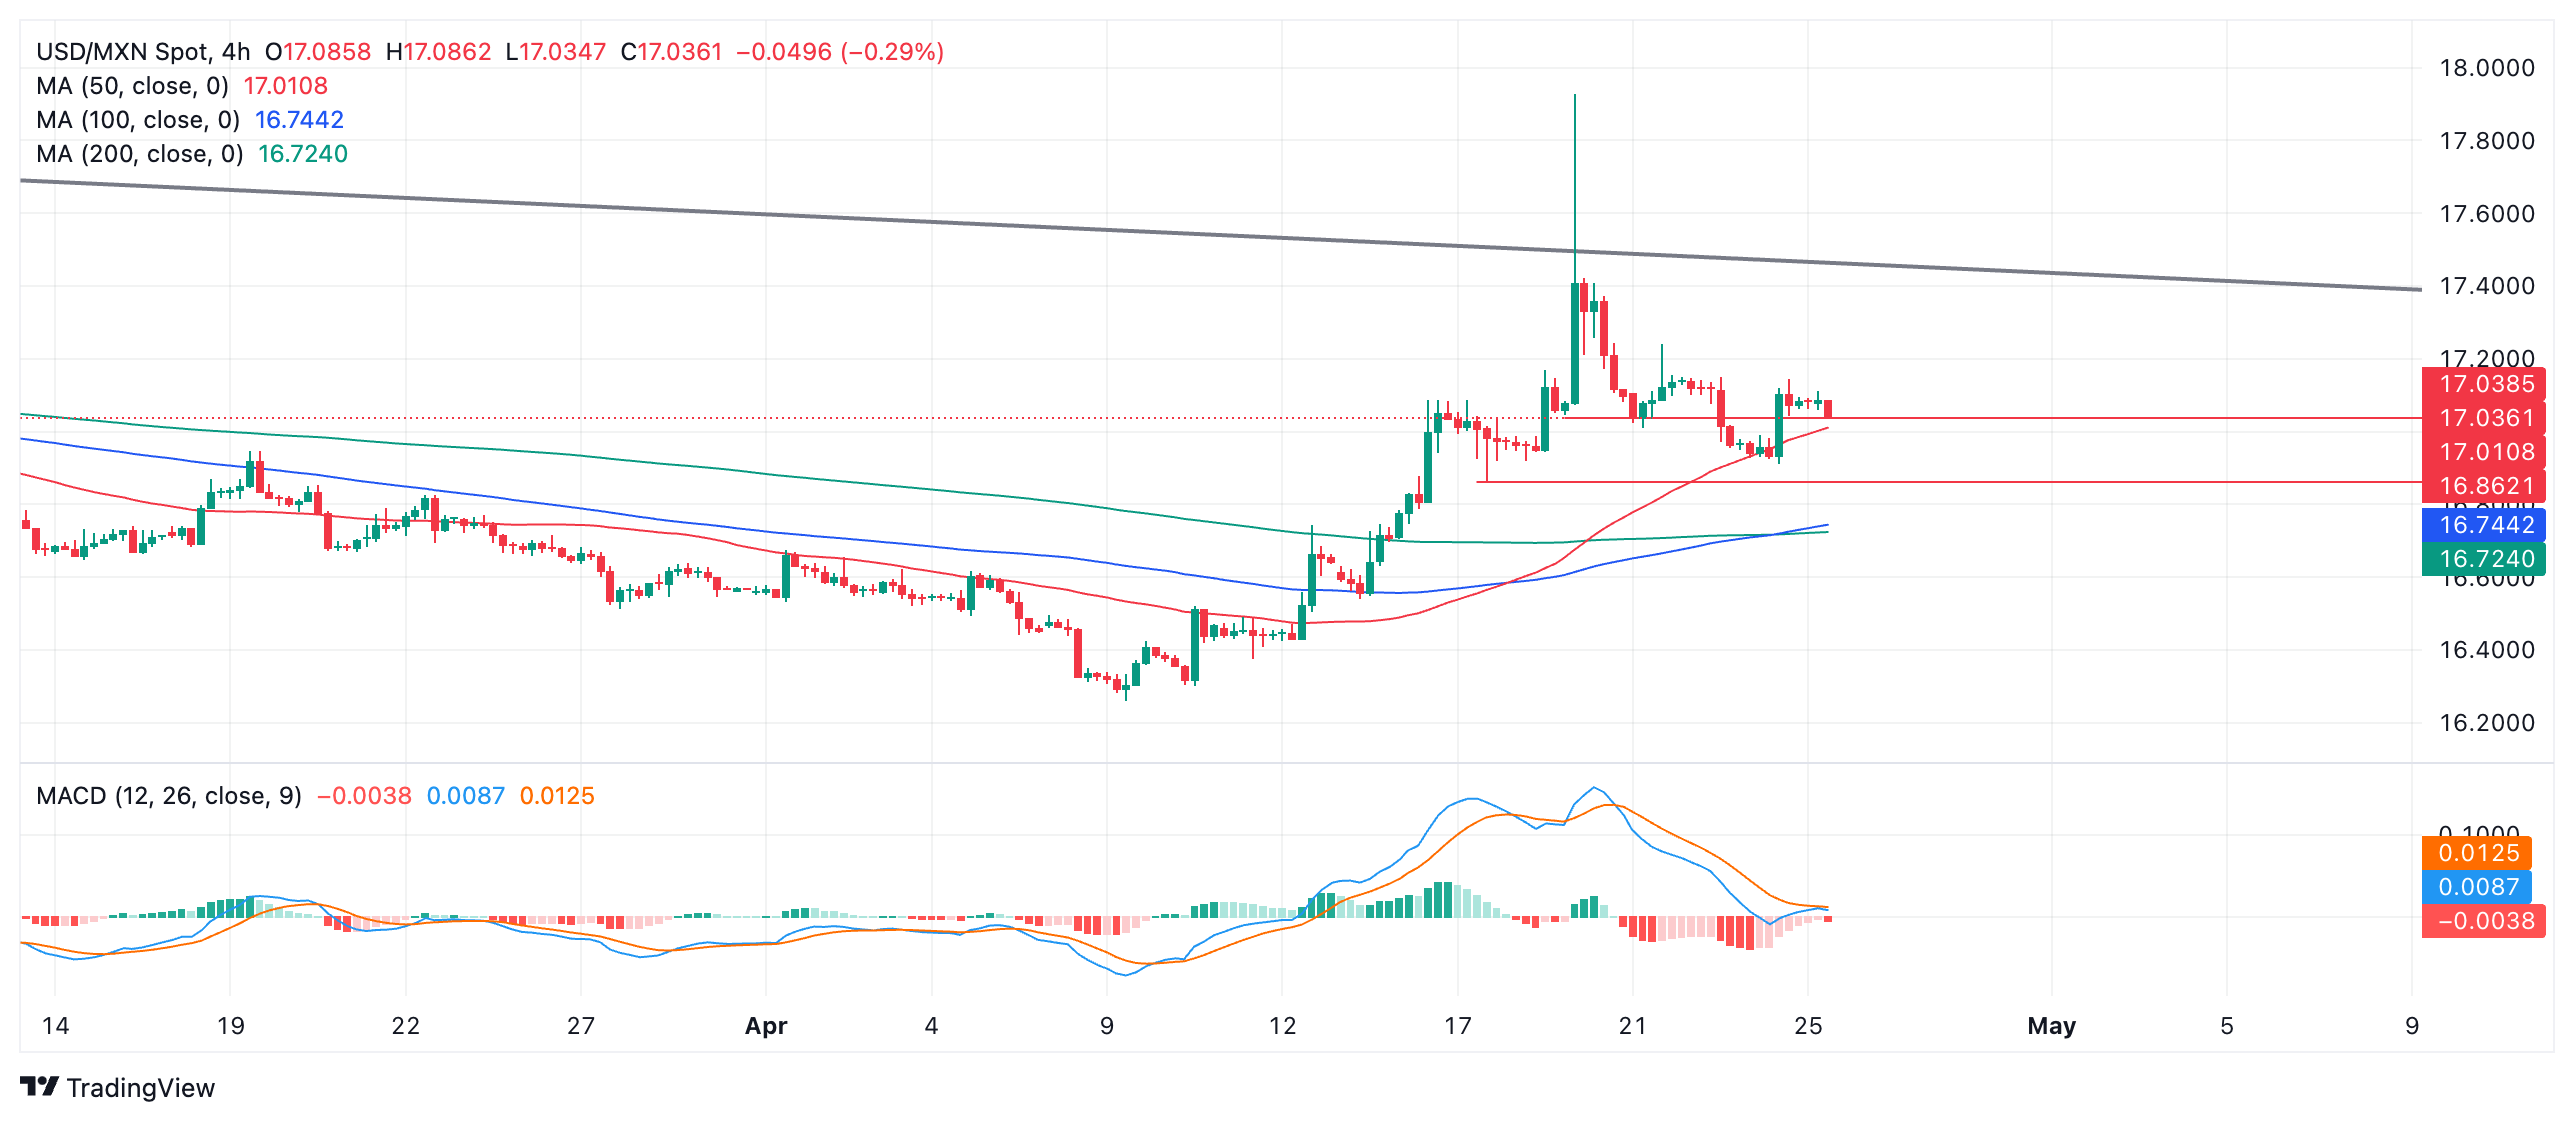
A break below Wednesday’s swing low at 16.91 would confirm further downside to the next key support level at April 17 low at 16.86, where a major Moving Average sits, providing dynamic support on a higher time frame chart. A decisive break below 16.86 could usher in further weakness to 16.50 and then the April 9 low at 16.26.
On the other side, a decisive break above the major trendline for the long-term downtrend at roughly 17.45 will be required to change the trend back to bullish, and activate an upside target at around 18.15.
A decisive break would be one characterized by a longer-than-average green daily candlestick that pierces above the trendline and closes near its high, or three green candlesticks in a row that pierce above the level.
Economic Indicator
Gross Domestic Product Price Index
The Gross Domestic Product (GDP) Price Index, released quarterly by the Bureau of Economic Analysis, measures the change in the prices of goods and services produced in the United States. The prices that Americans pay for imports aren’t included. Changes in the GDP price index are followed as an indicator of inflationary pressures, which may anticipate higher interest rates. A high reading is seen as bullish for the US Dollar (USD), while a low reading is seen as bearish.
Read more.Last release: Thu Apr 25, 2024 12:30 (Prel)
Frequency: Quarterly
Actual: 3.1%
Consensus: -
Previous: 1.7%
Source: US Bureau of Economic Analysis
Author

Joaquin Monfort
FXStreet
Joaquin Monfort is a financial writer and analyst with over 10 years experience writing about financial markets and alt data. He holds a degree in Anthropology from London University and a Diploma in Technical analysis.


